What
drives political instability and violent conflict in the developing
world? Researchers at the Centre for the Study of Civil War (CSCW)
- an organization within the International Peace Research Institute,
Oslo - are working to better understand the complex answers to that
question. They examine conflicts to determine the relationships between
combatants, social groups, economies and natural phenomena - and much
of their data are location-based.
In 2005, Dr. Clionadh Raleigh of CSCW set out to create a conflict database that would help answer researchers' questions. The Armed Conflict Location and Event Data (ACLED) project was born and not long after, the World Bank funded the effort in the hope of better understanding events in client states. The World Bank's involvement enabled the ACLED team to expand its research from Central Africa to some of the world's most unstable regions. But it also meant that the team was tasked with handling more data and providing near real-time information.
To meet the challenge, Dr. Raleigh and her fellow CSCW researchers adopted SpatialKey, Universal Mind's Software as a Services (SaaS) location intelligence application. They use the tool to create and share graphically rich, interactive time- and map-based analyses and reports from their conflict data, and they've improved their research methodologies as a result.
Identifying conflicts' component parts
ACLED stores detailed conflict information from sources including local and national newspaper reports and accounts from groups such as Human Rights Watch. But before the researchers began using SpatialKey, the process of mapping and analyzing these data was difficult and time-consuming.
Dr. Raleigh used Microsoft Excel and Access software to code conflict data such as events, dates, coordinates and participants. Then she would import the coded data into a standard GIS environment.
The work was slow going. "I used to spend literally days to come up
with a few maps," she said. Even simple questions that needed
geospatial analysis required an investment of time her small team
couldn't afford. Integrating and displaying disparate datasets on the
same map - and manipulating those data to understand the interactions
and implications - was a process that took weeks, if it could be done
at all. Further, analyzing the data over time and over geography was
equally challenging, if not impossible.
The team needed an easy way to identify patterns in their data. They wanted to view certain groups dynamically, for example as they crossed borders. They also needed a better way to share their data. Conflict researchers shared information in papers and at conferences - often via static maps - and they sometimes exchanged Excel files and shapefiles via email. But most groups worked in relative isolation.
Accelerating analysis and insight
CSCW researcher Andrew Linke began looking for a visualization tool that was similar to Google Earth but that was able to isolate specific actors and other conflict components. He discovered SpatialKey and his team began using the tool to map and analyze their data.
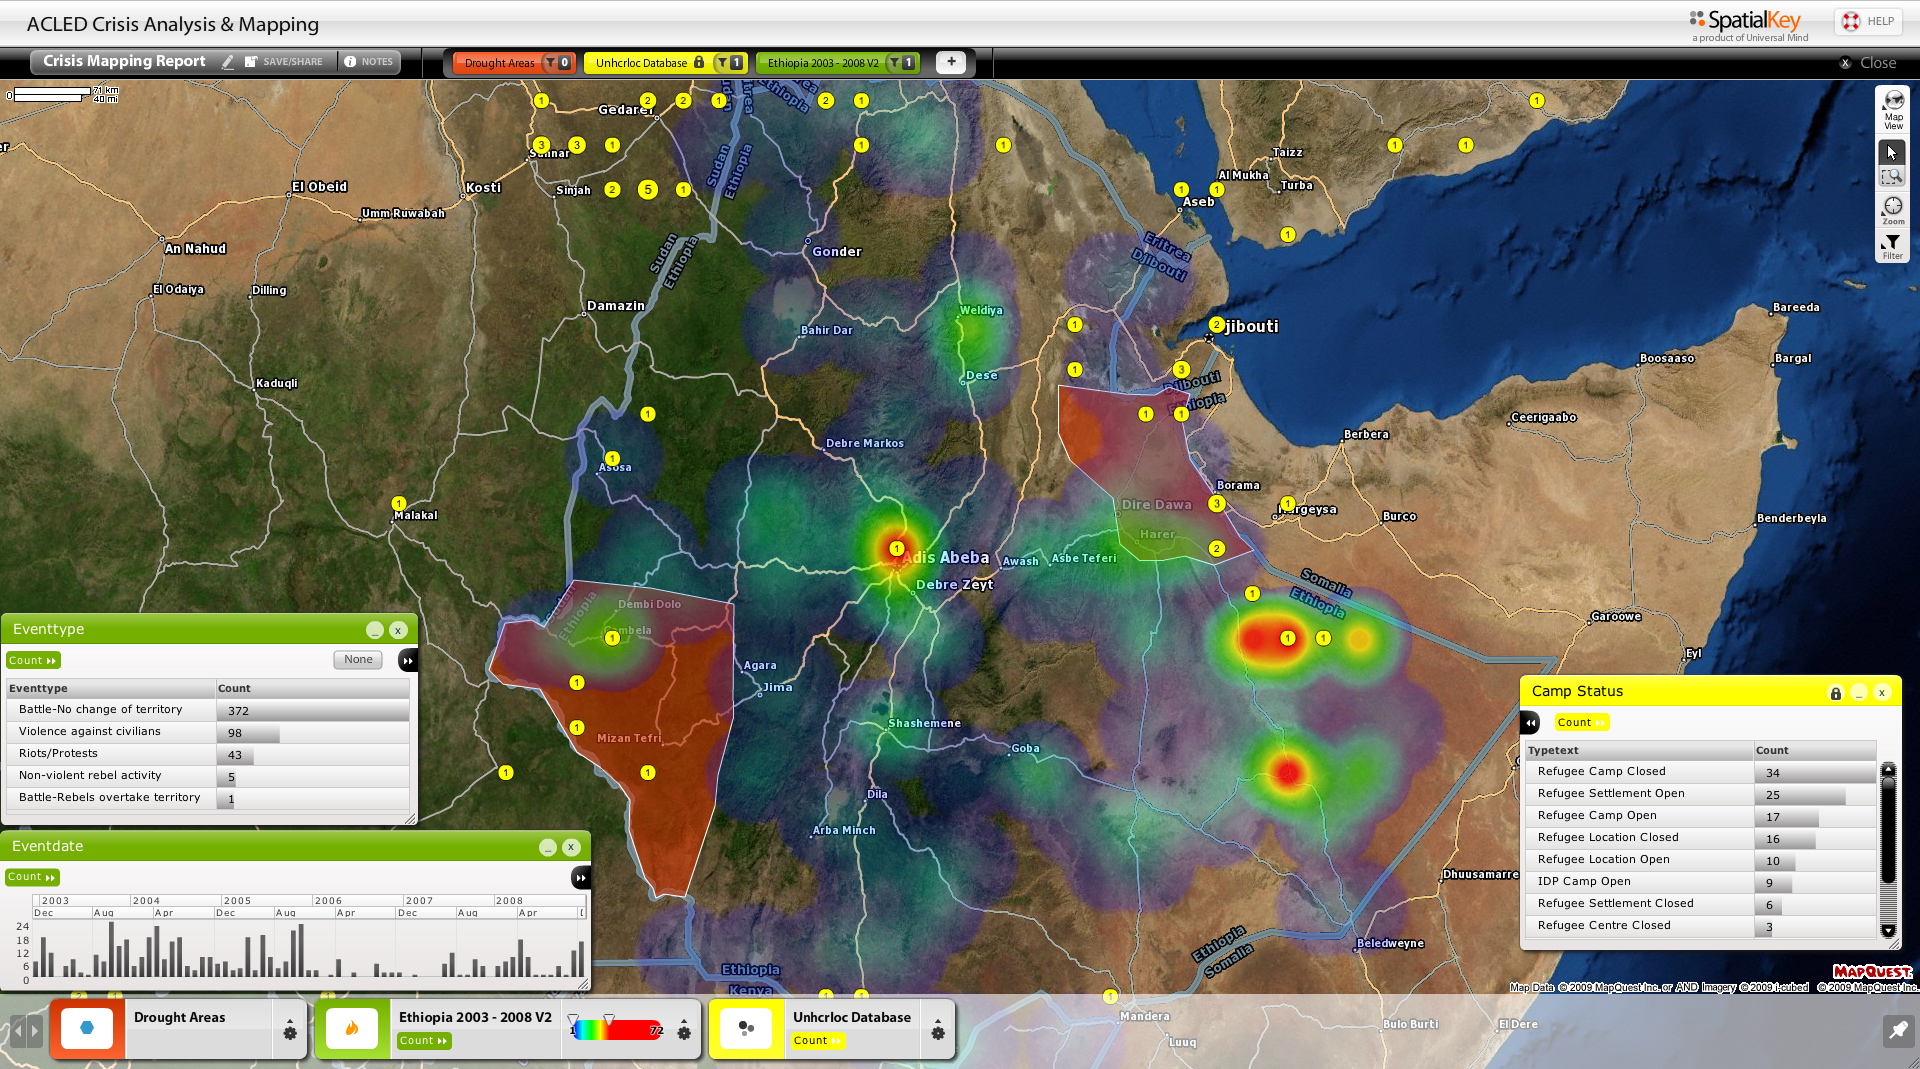
The application's analysis and visualization capabilities have helped the researchers more quickly identify factors that drive political and economic instability and, in turn, violent conflict. But it has also helped the team improve methodologies for the academic investigation of conflict patterns.
"The proximity analysis capabilities are quite useful for individual questions, like ‘Did the majority of events in Sierra Leone happen within 10 miles of a refugee camp?'" said Dr. Raleigh. "I can look at hotspots within an area, see the propensity of camps to attract or be the center of violence."
The team has also used the feature to challenge assumptions. According
to Dr. Raleigh, many people have considered civil wars to be primarily
rural events, but proximity analysis has shown that these conflicts
tend to happen close to larger cities as rebel groups attempt to engage
with the military.
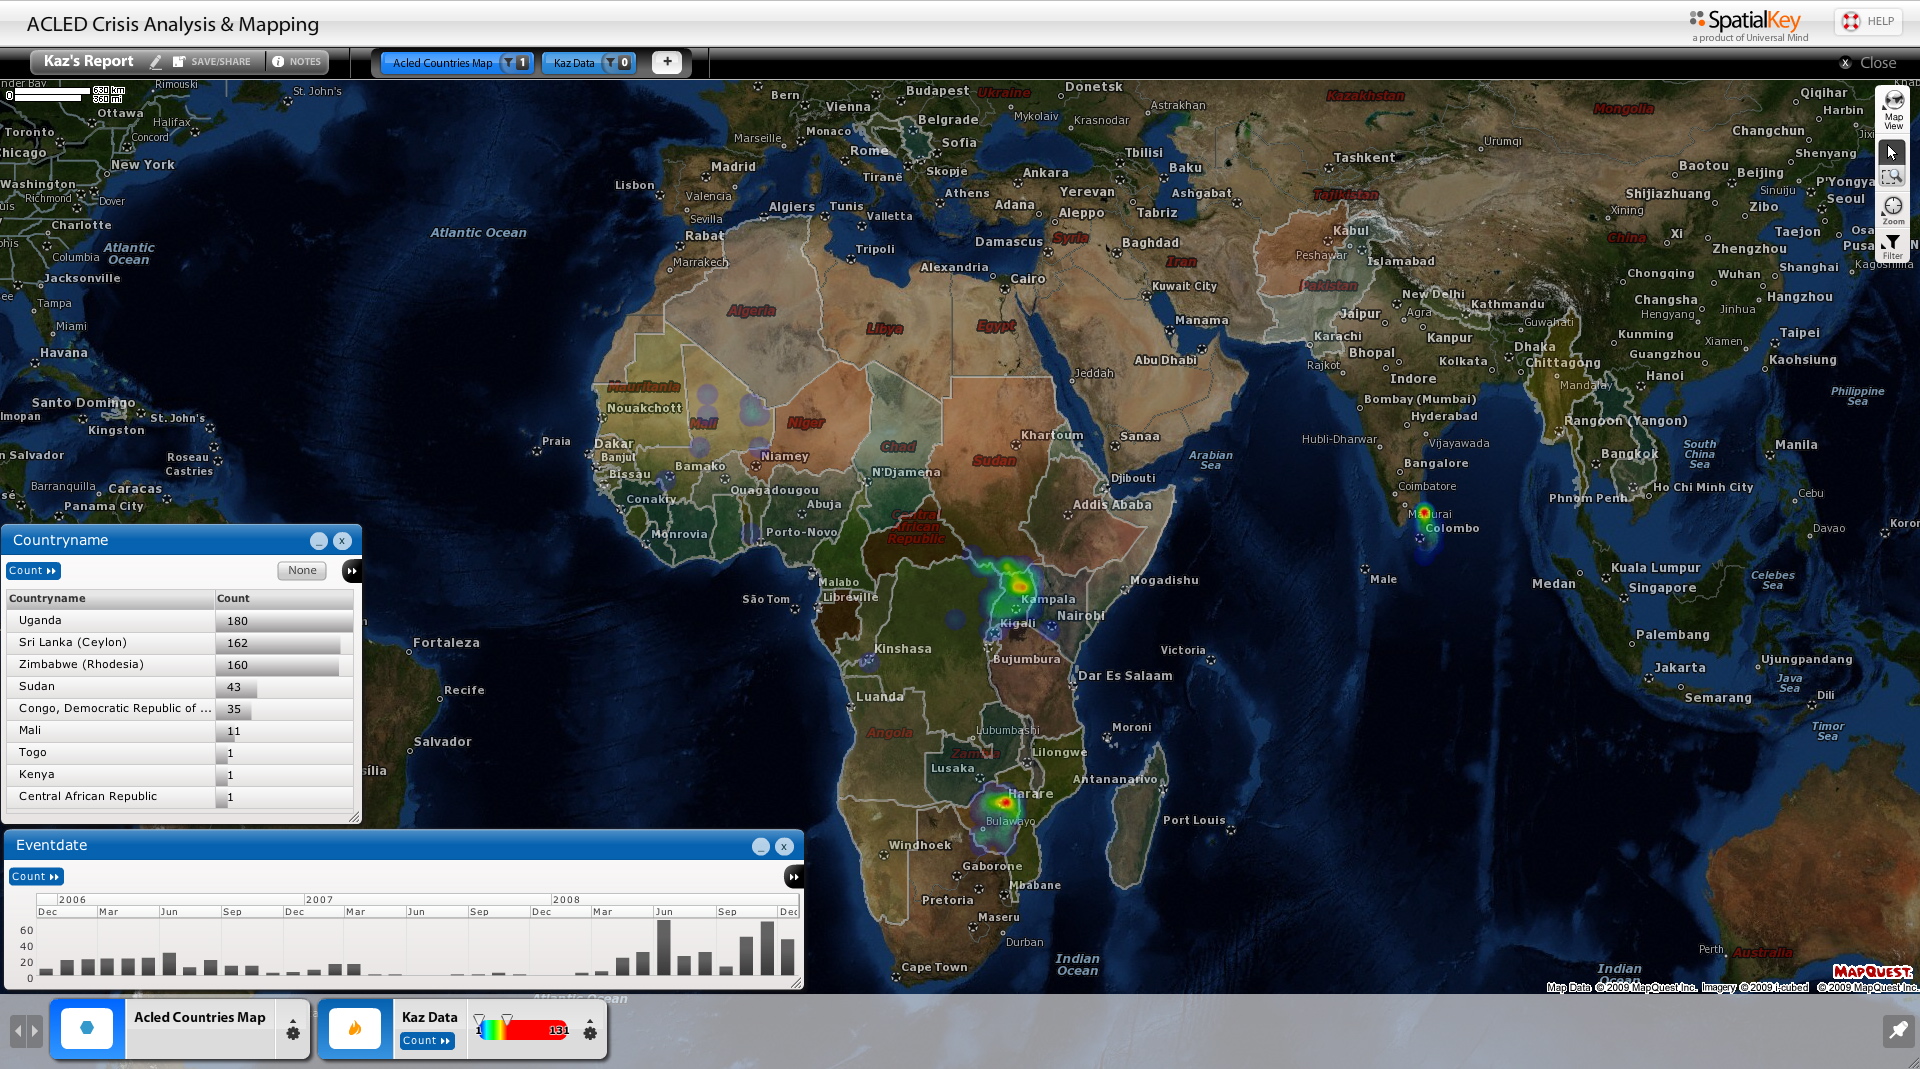
Linke said the filtering tools give him the freedom to examine more than just existing regional boundaries. He can add his own shapes and lines to a map to define a zone of interest.
"You can filter conflict events by those occurring within 10 miles of the capitals of two different states at the same time," he said. "This kind of cross-national filtering of data based on a specific definition can be somewhat difficult otherwise - usually only people trained in traditional GIS platforms can do it."
The SaaS environment also enables members of the larger research community to do their own exploration and analysis. For those who want to view a particular conflict, the website provides an easy and interactive way to visualize dynamics. For those who need information on rebel movement, conflict diffusion or conflict cycles, longer-term analysis is possible. In addition, users can integrate their own spatial or temporal data with ACLED data for others to incorporate into their own work.
Making the most of research budgets
By using the tool to visualize ACLED data, the team has saved money as well as time. In less than a year, Dr. Raleigh has saved approximately 10,000 euros in hired assistance with GIS mapping as well as 10,000 euros in efficiencies in her own work. Since public viewing of maps can be automated, the team will save 6,000 euros a year in technical assistance. And because the tool has helped expand the ACLED user base and has provided a dynamic platform for the display of data variations, she expects to bring in up to 50,000 euros in grant money in the near term.
Understanding conflict to advance peace
Previously limited in its ability to identify and understand patterns in conflict and crisis, the team now has a tool that enables the research community to inform predictive models of civil war.
"Our intent is to show that these conflict situations are not just chaos," said Dr. Raleigh, "but that there are readable, logical patterns that occur in a crisis or in an unstable area." With that knowledge, Dr. Raleigh and her fellow researchers hope to make progress toward their ultimate mission - promoting a more peaceful world through conflict resolution, dialogue and reconciliation, public information, and policymaking activities.
In 2005, Dr. Clionadh Raleigh of CSCW set out to create a conflict database that would help answer researchers' questions. The Armed Conflict Location and Event Data (ACLED) project was born and not long after, the World Bank funded the effort in the hope of better understanding events in client states. The World Bank's involvement enabled the ACLED team to expand its research from Central Africa to some of the world's most unstable regions. But it also meant that the team was tasked with handling more data and providing near real-time information.
To meet the challenge, Dr. Raleigh and her fellow CSCW researchers adopted SpatialKey, Universal Mind's Software as a Services (SaaS) location intelligence application. They use the tool to create and share graphically rich, interactive time- and map-based analyses and reports from their conflict data, and they've improved their research methodologies as a result.
Identifying conflicts' component parts
ACLED stores detailed conflict information from sources including local and national newspaper reports and accounts from groups such as Human Rights Watch. But before the researchers began using SpatialKey, the process of mapping and analyzing these data was difficult and time-consuming.
Dr. Raleigh used Microsoft Excel and Access software to code conflict data such as events, dates, coordinates and participants. Then she would import the coded data into a standard GIS environment.
 |
The team needed an easy way to identify patterns in their data. They wanted to view certain groups dynamically, for example as they crossed borders. They also needed a better way to share their data. Conflict researchers shared information in papers and at conferences - often via static maps - and they sometimes exchanged Excel files and shapefiles via email. But most groups worked in relative isolation.
Accelerating analysis and insight
CSCW researcher Andrew Linke began looking for a visualization tool that was similar to Google Earth but that was able to isolate specific actors and other conflict components. He discovered SpatialKey and his team began using the tool to map and analyze their data.
The application's analysis and visualization capabilities have helped the researchers more quickly identify factors that drive political and economic instability and, in turn, violent conflict. But it has also helped the team improve methodologies for the academic investigation of conflict patterns.
"The proximity analysis capabilities are quite useful for individual questions, like ‘Did the majority of events in Sierra Leone happen within 10 miles of a refugee camp?'" said Dr. Raleigh. "I can look at hotspots within an area, see the propensity of camps to attract or be the center of violence."
 |
Linke said the filtering tools give him the freedom to examine more than just existing regional boundaries. He can add his own shapes and lines to a map to define a zone of interest.
"You can filter conflict events by those occurring within 10 miles of the capitals of two different states at the same time," he said. "This kind of cross-national filtering of data based on a specific definition can be somewhat difficult otherwise - usually only people trained in traditional GIS platforms can do it."
The SaaS environment also enables members of the larger research community to do their own exploration and analysis. For those who want to view a particular conflict, the website provides an easy and interactive way to visualize dynamics. For those who need information on rebel movement, conflict diffusion or conflict cycles, longer-term analysis is possible. In addition, users can integrate their own spatial or temporal data with ACLED data for others to incorporate into their own work.
Making the most of research budgets
By using the tool to visualize ACLED data, the team has saved money as well as time. In less than a year, Dr. Raleigh has saved approximately 10,000 euros in hired assistance with GIS mapping as well as 10,000 euros in efficiencies in her own work. Since public viewing of maps can be automated, the team will save 6,000 euros a year in technical assistance. And because the tool has helped expand the ACLED user base and has provided a dynamic platform for the display of data variations, she expects to bring in up to 50,000 euros in grant money in the near term.
Understanding conflict to advance peace
Previously limited in its ability to identify and understand patterns in conflict and crisis, the team now has a tool that enables the research community to inform predictive models of civil war.
"Our intent is to show that these conflict situations are not just chaos," said Dr. Raleigh, "but that there are readable, logical patterns that occur in a crisis or in an unstable area." With that knowledge, Dr. Raleigh and her fellow researchers hope to make progress toward their ultimate mission - promoting a more peaceful world through conflict resolution, dialogue and reconciliation, public information, and policymaking activities.
From Our Homepage
Saying Farewell to an Amazing Journey
Communicating with Maps
Is There a GIS Career Ladder?
What does it mean to be geospatially smart? Series
Ways Real Estate and Property Developers Utilize Melissa GeoData for Data-Driven Decisions
Unlocking Value From Daily Satellite Imagery and Insights
Maximizing the Value of Your Address Data with Geo Addressing
How Indoor Mapping Enhances the Security of Smart Buildings
Look Ahead: AI, Location Intelligence and Efficiency
Collaboration Takes on Sea Level Rise & Dynamic Technology Environments
Brownies for Brownfields
Has Everything Been Mapped Already?
How Is Data Literacy Changing in an Artificial Intelligence Landscape
Portfolios for GIS Professionals: More Than Just Maps
How to Create a Distance Matrix in QGIS - A Step-by-Step Guide
7 Ideas for Bringing GIS into the K-12 Classroom
The Geography of Movement