20/20 Companies
set two priorities - replacing an outdated process and maximizing
return on investment - when this marketing and direct sales company
implemented a new application for one of its core business processes.
Previously, company analysts used a hodge-podge of software
programs and manual processes to map the locations of sales leads,
divide them into walkable areas for the sales reps, and distribute
these data to team managers. That meant analysts spent most of their
time racing to complete this task and keep the sales teams supplied
with leads. The company implemented a sales mapping "mashup," built on
IDV's Visual Fusion, and cut lead processing time in half.
Texas-based 20/20 Companies serves the telecommunications, cable and energy industries with direct marketing services, including teams of door-to-door sales reps. The company's clients typically supply it with large files of sales leads; each file may contain the addresses of as many as four million potential customers. To divide this flood of leads into geographic routes for its sales teams, the company used a cumbersome, multi-step process.
Each week, analysts would load these millions of addresses into a database for sorting by region and ZIP Code. They would export the sorted data to spreadsheets, and then load the spreadsheets into mapping software, all so they could divide the data into areas of a few blocks for each rep.
Next, they had to re-export the results into spreadsheets, from which they cut and pasted the groups of addresses into documents to send to the team managers. Processing addresses could take up to two weeks depending upon the size and scope of the lead file. "It was an extraordinarily manual process," said Sarah Wilson, the analysts' manager.
The solution
Knowing they needed a better solution, the company spent months evaluating a range of off-the-shelf and custom software choices. They eventually chose Visual Fusion based on its rich Silverlight interface and configurability, said Scott Gross, 20/20's Information Systems manager.
Working together, 20/20 Companies and IDV Solutions built an industry-first sales mapping technology named Ngen Leads. IDV supplied a user interface, data connectors and tools that allowed the two companies to build an interactive visualization of the sales lead data with Visual Fusion. The new application streamlines the process of assigning the sales routes and provides critical analysis for the company's management.
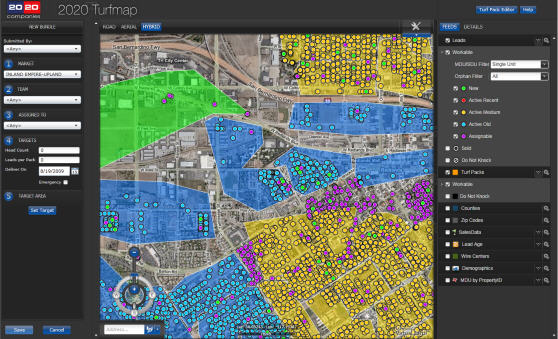
In the new application, sales lead addresses are loaded into SQL Server 2008. Visual Fusion connects to this database and maps the leads via Bing Maps. Analysts review the sales lead locations on the application map and use Visual Fusion's drawing tools to draw territories for each sales rep onscreen.
Using these polygons, spatial queries are run against the database and then connect to SQL Reporting Services to return the results as a report in PDF format. The report is saved in a SharePoint library for team managers to download. The application tracks these downloads, so the same area is never assigned to more than one team. This process is done twice a week, supplying sales areas for 1,500 reps.
New functionality
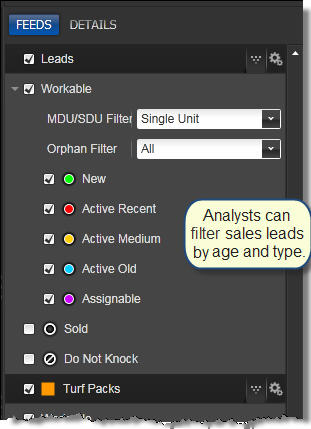
With the new application, analysts gain a visual understanding of where the leads are. The interface optimizes their view of this large collection of data; as a user zooms out, overlapping icons are automatically consolidated into clusters that break apart again as the user zooms in. The visualization provides 20/20 with new capabilities, such as color coding leads by age, filtering by type (apartment complexes vs. single units) and assigning "Do not knock" labels to areas and customers who've asked not to be solicited.
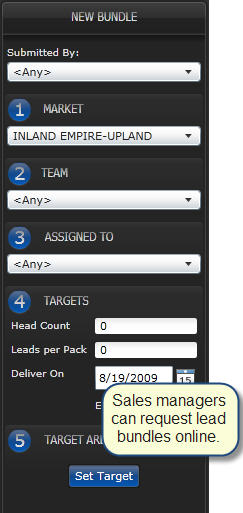
A two-way workflow is part of the application design. Regional directors can now request new bundles of leads through the application's "Bundle Request Editor," specifying a sales area, a sales team, the number of reps, the desired number of leads for each, and a delivery date. Bundle requests can be designated "emergency" for priority status and quick turnaround.
Also, because it's easy to add feeds through Visual Fusion, 20/20 was able to enhance its map with census data, county and ZIP Code boundaries, sales history and other feeds. Upper management uses this information to analyze sales performance and look for areas of new opportunity.
Looking forward
The introduction of the application has cut 20/20 Companies' costs for lead processing in half. It saves significant time each week, cutting lead processing from two weeks to two days. Moreover, the geocoding process through Visual Fusion provides a more accurate map for each sales rep.
The company plans to extend the NGen Leads application to include additional sales analytics. This new functionality will pinpoint sales target areas based on multiple data sources. With this potential for further enhancement, 20/20 expects the application to serve it well, both now and into the future.
"20/20 was looking for a solution that would allow data with any geometry associated with it to be visualized on a map within minutes," said Scott Gross. "We saw [Visual Fusion] as a key technology that could let us easily deploy a rich client interface and handle the large amount of data required by the application."
Texas-based 20/20 Companies serves the telecommunications, cable and energy industries with direct marketing services, including teams of door-to-door sales reps. The company's clients typically supply it with large files of sales leads; each file may contain the addresses of as many as four million potential customers. To divide this flood of leads into geographic routes for its sales teams, the company used a cumbersome, multi-step process.
Each week, analysts would load these millions of addresses into a database for sorting by region and ZIP Code. They would export the sorted data to spreadsheets, and then load the spreadsheets into mapping software, all so they could divide the data into areas of a few blocks for each rep.
Next, they had to re-export the results into spreadsheets, from which they cut and pasted the groups of addresses into documents to send to the team managers. Processing addresses could take up to two weeks depending upon the size and scope of the lead file. "It was an extraordinarily manual process," said Sarah Wilson, the analysts' manager.
The solution
Knowing they needed a better solution, the company spent months evaluating a range of off-the-shelf and custom software choices. They eventually chose Visual Fusion based on its rich Silverlight interface and configurability, said Scott Gross, 20/20's Information Systems manager.
Working together, 20/20 Companies and IDV Solutions built an industry-first sales mapping technology named Ngen Leads. IDV supplied a user interface, data connectors and tools that allowed the two companies to build an interactive visualization of the sales lead data with Visual Fusion. The new application streamlines the process of assigning the sales routes and provides critical analysis for the company's management.
In the new application, sales lead addresses are loaded into SQL Server 2008. Visual Fusion connects to this database and maps the leads via Bing Maps. Analysts review the sales lead locations on the application map and use Visual Fusion's drawing tools to draw territories for each sales rep onscreen.
 |
Using these polygons, spatial queries are run against the database and then connect to SQL Reporting Services to return the results as a report in PDF format. The report is saved in a SharePoint library for team managers to download. The application tracks these downloads, so the same area is never assigned to more than one team. This process is done twice a week, supplying sales areas for 1,500 reps.
 |
With the new application, analysts gain a visual understanding of where the leads are. The interface optimizes their view of this large collection of data; as a user zooms out, overlapping icons are automatically consolidated into clusters that break apart again as the user zooms in. The visualization provides 20/20 with new capabilities, such as color coding leads by age, filtering by type (apartment complexes vs. single units) and assigning "Do not knock" labels to areas and customers who've asked not to be solicited.
A two-way workflow is part of the application design. Regional directors can now request new bundles of leads through the application's "Bundle Request Editor," specifying a sales area, a sales team, the number of reps, the desired number of leads for each, and a delivery date. Bundle requests can be designated "emergency" for priority status and quick turnaround.
Also, because it's easy to add feeds through Visual Fusion, 20/20 was able to enhance its map with census data, county and ZIP Code boundaries, sales history and other feeds. Upper management uses this information to analyze sales performance and look for areas of new opportunity.
 |
Looking forward
The introduction of the application has cut 20/20 Companies' costs for lead processing in half. It saves significant time each week, cutting lead processing from two weeks to two days. Moreover, the geocoding process through Visual Fusion provides a more accurate map for each sales rep.
The company plans to extend the NGen Leads application to include additional sales analytics. This new functionality will pinpoint sales target areas based on multiple data sources. With this potential for further enhancement, 20/20 expects the application to serve it well, both now and into the future.
"20/20 was looking for a solution that would allow data with any geometry associated with it to be visualized on a map within minutes," said Scott Gross. "We saw [Visual Fusion] as a key technology that could let us easily deploy a rich client interface and handle the large amount of data required by the application."
From Our Homepage
Saying Farewell to an Amazing Journey
Communicating with Maps
Is There a GIS Career Ladder?
What does it mean to be geospatially smart? Series
Ways Real Estate and Property Developers Utilize Melissa GeoData for Data-Driven Decisions
Unlocking Value From Daily Satellite Imagery and Insights
Maximizing the Value of Your Address Data with Geo Addressing
How Indoor Mapping Enhances the Security of Smart Buildings
Look Ahead: AI, Location Intelligence and Efficiency
Collaboration Takes on Sea Level Rise & Dynamic Technology Environments
Brownies for Brownfields
Has Everything Been Mapped Already?
How Is Data Literacy Changing in an Artificial Intelligence Landscape
Portfolios for GIS Professionals: More Than Just Maps
How to Create a Distance Matrix in QGIS - A Step-by-Step Guide
7 Ideas for Bringing GIS into the K-12 Classroom
The Geography of Movement