Ed. note: This article first appeared on Brian Noyle's blog and is reprinted here with permission.
Articles in this series:
Usability and the GeoWeb: Part 1 of ?
Usability and the GeoWeb Part 2: Provide Feedback
Usability and the GeoWeb Part 3: Protect Your Users From Themselves
Usability and the GeoWeb Part 4: Make it Fast
It's taken me awhile to get to it due to a variety of work and family obligations but we've finally reached what will be my final post on usability and the geoweb...for now at least. I haven't covered all possible usability issues and scenarios, but have hit the high points and "big win" factors over the course of this series of posts. To this point we've dealt with hiding complexity from our users, providing users with consistent, meaningful feedback within an application, and protecting users from themselves. The lesson plan for this last installment will focus on application performance and its criticality in the overall user experience.
 Fact:
One of the most critical components of a highly usable software system
is that it be highly performant...in other words, fast. In the realm of
the GeoWeb, this means that applications should load fast initially,
and that responses to user activity within the application should be as
quick as possible. We now live in a world of instant gratification when
it comes to our news, our hobbies, our finances, and above all our
interactions with computers. Users don't like to be kept waiting for 5
seconds every time they use your app to request information, input
data, or perform other common processing tasks. Gone are the days when
watching the blue bar move in a web app, or watching the cursor spin on
a wireless app were the status quo. And frankly with the amount that
we, as consultants, get paid to build custom software, the user
shouldn't have to wait.
Fact:
One of the most critical components of a highly usable software system
is that it be highly performant...in other words, fast. In the realm of
the GeoWeb, this means that applications should load fast initially,
and that responses to user activity within the application should be as
quick as possible. We now live in a world of instant gratification when
it comes to our news, our hobbies, our finances, and above all our
interactions with computers. Users don't like to be kept waiting for 5
seconds every time they use your app to request information, input
data, or perform other common processing tasks. Gone are the days when
watching the blue bar move in a web app, or watching the cursor spin on
a wireless app were the status quo. And frankly with the amount that
we, as consultants, get paid to build custom software, the user
shouldn't have to wait.
Headlong into the breach then for our fourth and final lesson...
Lesson 4: Maximize Real and Perceived Performance
In all my years of software development, I've never had a user or a client come to me and say,
"Ya' know Brian, this app is just too fast...please slow it down."
No matter how much time architects, developers, and UX folks spend designing and building the sexiest GeoWeb app you've ever seen, all that work is wasted if the user base is frustrated by long wait times to execute functions within the application. It doesn't matter how well you automate a customer's workflow if they're left sitting and twiddling their thumbs for 5-10 seconds every time they push a button.
Real Performance
There are a whole host of tools in the IT and software professional's toolbox that help us maximize application and database performance. Processing power and RAM, faster network, server farm configurations, database indexing and denormalization, etc., etc. Those standard tools are beyond the scope of this article as they are relatively well understood. What I'm most interested in covering is how to squeeze more performance out of our maps given a fixed IT configuration. Real performance in our mapping realm means configuring map services to be fast from the start, caching whenever possible, and applying novel techniques to handle large datasets.
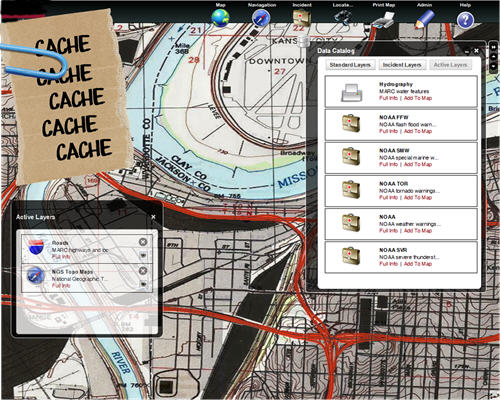
Fewer Layers, Appropriate Symbology and Annotation
I covered this point in the first post in the usability series back in July. The idea that users need to see all of the layers in your geodatabase to accomplish a task is ridiculous. No matter how big your server farm is, no matter how fast your processors are or how much RAM you have, large numbers of map layers are going to slow the system down. Focus applications on 3-5 operational layers over a base tile cache to reap significance performance gains over the kitchen sink style application paradigm.
Another trend that we frequently see in diagnosing map-related performance issues is a map that contains complex symbology and excessive annotation in the absence of a defined business need. A dynamic map service showing highway signs over the highways is neat but these symbols need to be rendered in four parts on the server (red, white, blue, and text) and take much longer than standard line types. In most cases, variance in line weight and color, coupled with scale dependent rendering by road type would convey the same information to the user without the performance hit. Save the complexity for cached services and be as simple as possible in dynamic map services.
Annotation is a valuable tool for adding information to maps beyond the spatial relationships conveyed by the feature geometries. It is also frequently misused. Applications that annotate large numbers of layers with all manner of non-critical information rapidly become cluttered and unusable, in addition to incurring the performance hit associated with rendering all that annotation in the map. Do parcels really need: PIN, dimensions, area, address, owner name, the names of the owner's seven children and summaries of the last 5 years tax returns? Probably not. Keep the annotation appropriate for the map scale and germane to the information you are trying to convey. If it isn't relevant to the business problem at hand...leave it out.
Caching
One of the primary tools in our toolbox for maximizing the performance of GeoWeb style applications is the map tile cache. Think back to just a few years ago (pre-February 2005) and the thought of using a system of cached tiles in the era of "Web GIS" was unthinkable. As geo-technologists we were "special" and our data was simply too critical to have any latency. Our apps had to show that parcel split or that new forest boundary seconds after it came into existence. I think we can all agree that in February 2005, Google Maps showed us all that this line of thinking was just a bunch of hooey.
Nearly all emerging applications in the GeoWeb realm wind up leveraging a tile cache for base maps within the application. However in many of the more recent systems we have worked on, we have arrived at the assertion that you should cache as much as possible. With the exception of real time battlefield applications for the military, emergency response applications, and a very few other notable exceptions, we hold that you should cache everything. It is a relatively simple thing to set up an automated process the update a map cache of dynamic data at a time when everyone has gone home from the office and system utilization is typically low or nonexistent. Trust us, your users will wait 24 hrs to see that parcel update...really.
So, select a server side technology that supports caching map tiles for representation in the client, use a client side map viewer that will efficiently render cached map tiles, and automate cache creation/refresh if necessary to maximize map performance out of the gate.
Cluster Large Datasets
One of the challenges that we routinely face as developers in the age of the GeoWeb is how to deal with the representation of large numbers of geometries in the client. Direct rendering of geometries in the client becomes the preferred method of visual representation when we need those geometries and their attributes in the client for speedy response to user action: mouse over balloons, etc. While Flex and Silverlight offer opportunities to render larger numbers of geometries in the client efficiently, JavaScript based applications begin to experience performance degradation in the client after a couple hundred features or so. Start dealing with complex polygon geometries and the number is less than that. And even Silverlight and Flex aren't going to get you speedy rendering of thousands of geometries.
Consider the application shown above. This application supports a global surveillance network monitoring avian flu (H5N1) and is built using Microsoft Bing Maps and copious amounts of JavaScript. If we attempted to actually render global sample locations on the map, we'd likely crash the client as we're dealing with approximately 50,000 sample locations. Instead, we elected to cluster sampling points, aggregating data at small map scales and gradually showing additional sample locations as the user zooms in to larger map scales. The process looks something like that shown below:
This approach allows us to determine the map extent, select the points that fall within the current map extent, and then apply a clustering algorithm to aggregate points near one another before sending the details back to the browser. Another key point that we discovered is that spatial isn't always better. To perform the above tasks with data stored in ArcSDE, the average compute time was ~5 seconds. Using SQL Server 2008 Spatial data types natively got us down to about 2 seconds, while simply maintaining sample points as X and Y columns with the rest of the non-spatial data got us to less than 1/3 of a second response time. Don't be afraid to leave traditional spatial technologies behind when you can improve performance without sacrificing data integrity!
Using the approach described above, we were able to render points on the map AS FAST as the Bing tiles come into the browser.
Perceived Performance
Another powerful and underutilized means of improving the user experience within an application is to leverage implementation methods that provide perceived performance gains from the user's perspective. Because users seldom, if ever, care about the implementation details that solve their problem, we are able to use a bit of slight-of-hand to make a data intensive application very responsive.
The basic message for tweaking perceived performance is actually very simple: be lean on the wire. If you are building a data heavy app, and most of the line of business apps we build are, then take small bites rather than trying to ship down everything the user "might" ask for at once.
JSON and GeoJSON have become two popular and related formats for shipping data to the client for further processing and rendering, but if performance is the name of the game, don't be afraid to depart from standards and use a custom JSON formatter to send only the necessary data down to the client. In this case custom == fast == good!
Let's return to our H5N1 application for just a moment and consider what happens when we return all those points to the browser. Our custom JSON formatter returns only the information necessary to properly render points over the map. But at the same time, a user expects to see additional detail on sample sites when they mouse over a point so what's a developer to do? Sending all information for all points down and storing it in the client is certainly one option, however the odds that a user is going to mouse over all of the hundreds of points typically in any given map extent is miniscule so why send all that data over the wire? As shown in the example immediately above, when the user hovers their mouse over a sample point, we quickly shoot off a tiny XHR call to get a subset of the details. If they want more, they can click the View Details link in the mouse over window to get more information.
As another example, let's consider what happens when a user requests all the details for a site. The site flow dictates that we render the full sampling details in a tree view to the right of the map. For our purposes we selected the Yahoo! YUI tree view for reasons that will become apparent in just a moment.
When the user requests detailed information on an H5N1 sample site, we go to the server again via XHR call and get only the top level information that you see rendered above. This is why we selected the YUI tree view over other JS-based tree views. Dojo, JQuery, etc. either work on a full data store to render information or want to bind to a JSON object that has been fully filled. YUI lets us load information on a node by node basis and this is critical to maximizing perceived performance in this case because, again, the likelihood of a user clicking on every single bird species in small. If the user clicks on a species in the tree view, we go fetch only the next node of information, and so on, and so on. Be lean on the wire.
Parting Shots
So here endeth the homily, go forth and develop some more. Have I hit all the critical points? Probably not. The field of usability and UX carries with it a substantial set of principles for buidling killer apps with great interfaces and my periodic usability rants are less a codex and more an appeal to the wider development community to continue to hold web GIS at arms length and continue to the march toward more highly performant, usable, focused applications. The take away from all this should be that we, as a community, need to focus more effort on providing our user base with relevant information right now, and less effort on flexing our GIS muscles by seeing how much crap we can cram into a browser.
Articles in this series:
Usability and the GeoWeb: Part 1 of ?
Usability and the GeoWeb Part 2: Provide Feedback
Usability and the GeoWeb Part 3: Protect Your Users From Themselves
Usability and the GeoWeb Part 4: Make it Fast
It's taken me awhile to get to it due to a variety of work and family obligations but we've finally reached what will be my final post on usability and the geoweb...for now at least. I haven't covered all possible usability issues and scenarios, but have hit the high points and "big win" factors over the course of this series of posts. To this point we've dealt with hiding complexity from our users, providing users with consistent, meaningful feedback within an application, and protecting users from themselves. The lesson plan for this last installment will focus on application performance and its criticality in the overall user experience.
Fact:
One of the most critical components of a highly usable software system
is that it be highly performant...in other words, fast. In the realm of
the GeoWeb, this means that applications should load fast initially,
and that responses to user activity within the application should be as
quick as possible. We now live in a world of instant gratification when
it comes to our news, our hobbies, our finances, and above all our
interactions with computers. Users don't like to be kept waiting for 5
seconds every time they use your app to request information, input
data, or perform other common processing tasks. Gone are the days when
watching the blue bar move in a web app, or watching the cursor spin on
a wireless app were the status quo. And frankly with the amount that
we, as consultants, get paid to build custom software, the user
shouldn't have to wait.Headlong into the breach then for our fourth and final lesson...
Lesson 4: Maximize Real and Perceived Performance
In all my years of software development, I've never had a user or a client come to me and say,
"Ya' know Brian, this app is just too fast...please slow it down."
No matter how much time architects, developers, and UX folks spend designing and building the sexiest GeoWeb app you've ever seen, all that work is wasted if the user base is frustrated by long wait times to execute functions within the application. It doesn't matter how well you automate a customer's workflow if they're left sitting and twiddling their thumbs for 5-10 seconds every time they push a button.
Real Performance
There are a whole host of tools in the IT and software professional's toolbox that help us maximize application and database performance. Processing power and RAM, faster network, server farm configurations, database indexing and denormalization, etc., etc. Those standard tools are beyond the scope of this article as they are relatively well understood. What I'm most interested in covering is how to squeeze more performance out of our maps given a fixed IT configuration. Real performance in our mapping realm means configuring map services to be fast from the start, caching whenever possible, and applying novel techniques to handle large datasets.
Fewer Layers, Appropriate Symbology and Annotation
I covered this point in the first post in the usability series back in July. The idea that users need to see all of the layers in your geodatabase to accomplish a task is ridiculous. No matter how big your server farm is, no matter how fast your processors are or how much RAM you have, large numbers of map layers are going to slow the system down. Focus applications on 3-5 operational layers over a base tile cache to reap significance performance gains over the kitchen sink style application paradigm.
 |
Another trend that we frequently see in diagnosing map-related performance issues is a map that contains complex symbology and excessive annotation in the absence of a defined business need. A dynamic map service showing highway signs over the highways is neat but these symbols need to be rendered in four parts on the server (red, white, blue, and text) and take much longer than standard line types. In most cases, variance in line weight and color, coupled with scale dependent rendering by road type would convey the same information to the user without the performance hit. Save the complexity for cached services and be as simple as possible in dynamic map services.
Annotation is a valuable tool for adding information to maps beyond the spatial relationships conveyed by the feature geometries. It is also frequently misused. Applications that annotate large numbers of layers with all manner of non-critical information rapidly become cluttered and unusable, in addition to incurring the performance hit associated with rendering all that annotation in the map. Do parcels really need: PIN, dimensions, area, address, owner name, the names of the owner's seven children and summaries of the last 5 years tax returns? Probably not. Keep the annotation appropriate for the map scale and germane to the information you are trying to convey. If it isn't relevant to the business problem at hand...leave it out.
Caching
One of the primary tools in our toolbox for maximizing the performance of GeoWeb style applications is the map tile cache. Think back to just a few years ago (pre-February 2005) and the thought of using a system of cached tiles in the era of "Web GIS" was unthinkable. As geo-technologists we were "special" and our data was simply too critical to have any latency. Our apps had to show that parcel split or that new forest boundary seconds after it came into existence. I think we can all agree that in February 2005, Google Maps showed us all that this line of thinking was just a bunch of hooey.
 |
Nearly all emerging applications in the GeoWeb realm wind up leveraging a tile cache for base maps within the application. However in many of the more recent systems we have worked on, we have arrived at the assertion that you should cache as much as possible. With the exception of real time battlefield applications for the military, emergency response applications, and a very few other notable exceptions, we hold that you should cache everything. It is a relatively simple thing to set up an automated process the update a map cache of dynamic data at a time when everyone has gone home from the office and system utilization is typically low or nonexistent. Trust us, your users will wait 24 hrs to see that parcel update...really.
So, select a server side technology that supports caching map tiles for representation in the client, use a client side map viewer that will efficiently render cached map tiles, and automate cache creation/refresh if necessary to maximize map performance out of the gate.
Cluster Large Datasets
One of the challenges that we routinely face as developers in the age of the GeoWeb is how to deal with the representation of large numbers of geometries in the client. Direct rendering of geometries in the client becomes the preferred method of visual representation when we need those geometries and their attributes in the client for speedy response to user action: mouse over balloons, etc. While Flex and Silverlight offer opportunities to render larger numbers of geometries in the client efficiently, JavaScript based applications begin to experience performance degradation in the client after a couple hundred features or so. Start dealing with complex polygon geometries and the number is less than that. And even Silverlight and Flex aren't going to get you speedy rendering of thousands of geometries.
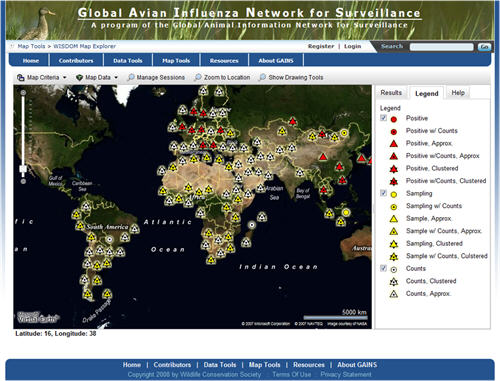 |
Consider the application shown above. This application supports a global surveillance network monitoring avian flu (H5N1) and is built using Microsoft Bing Maps and copious amounts of JavaScript. If we attempted to actually render global sample locations on the map, we'd likely crash the client as we're dealing with approximately 50,000 sample locations. Instead, we elected to cluster sampling points, aggregating data at small map scales and gradually showing additional sample locations as the user zooms in to larger map scales. The process looks something like that shown below:
 |
This approach allows us to determine the map extent, select the points that fall within the current map extent, and then apply a clustering algorithm to aggregate points near one another before sending the details back to the browser. Another key point that we discovered is that spatial isn't always better. To perform the above tasks with data stored in ArcSDE, the average compute time was ~5 seconds. Using SQL Server 2008 Spatial data types natively got us down to about 2 seconds, while simply maintaining sample points as X and Y columns with the rest of the non-spatial data got us to less than 1/3 of a second response time. Don't be afraid to leave traditional spatial technologies behind when you can improve performance without sacrificing data integrity!
Using the approach described above, we were able to render points on the map AS FAST as the Bing tiles come into the browser.
Perceived Performance
Another powerful and underutilized means of improving the user experience within an application is to leverage implementation methods that provide perceived performance gains from the user's perspective. Because users seldom, if ever, care about the implementation details that solve their problem, we are able to use a bit of slight-of-hand to make a data intensive application very responsive.
The basic message for tweaking perceived performance is actually very simple: be lean on the wire. If you are building a data heavy app, and most of the line of business apps we build are, then take small bites rather than trying to ship down everything the user "might" ask for at once.
JSON and GeoJSON have become two popular and related formats for shipping data to the client for further processing and rendering, but if performance is the name of the game, don't be afraid to depart from standards and use a custom JSON formatter to send only the necessary data down to the client. In this case custom == fast == good!
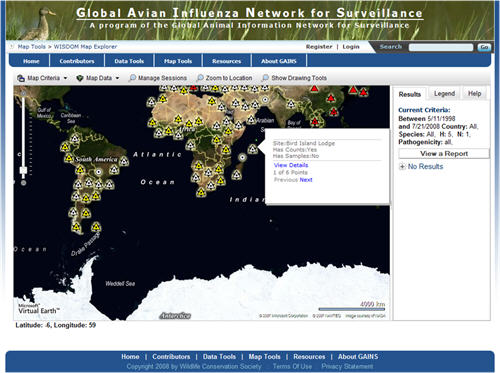 |
Let's return to our H5N1 application for just a moment and consider what happens when we return all those points to the browser. Our custom JSON formatter returns only the information necessary to properly render points over the map. But at the same time, a user expects to see additional detail on sample sites when they mouse over a point so what's a developer to do? Sending all information for all points down and storing it in the client is certainly one option, however the odds that a user is going to mouse over all of the hundreds of points typically in any given map extent is miniscule so why send all that data over the wire? As shown in the example immediately above, when the user hovers their mouse over a sample point, we quickly shoot off a tiny XHR call to get a subset of the details. If they want more, they can click the View Details link in the mouse over window to get more information.
As another example, let's consider what happens when a user requests all the details for a site. The site flow dictates that we render the full sampling details in a tree view to the right of the map. For our purposes we selected the Yahoo! YUI tree view for reasons that will become apparent in just a moment.
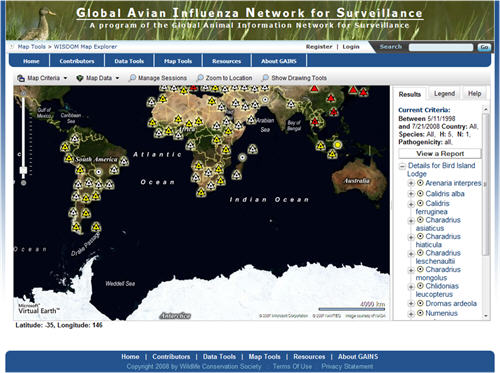 |
When the user requests detailed information on an H5N1 sample site, we go to the server again via XHR call and get only the top level information that you see rendered above. This is why we selected the YUI tree view over other JS-based tree views. Dojo, JQuery, etc. either work on a full data store to render information or want to bind to a JSON object that has been fully filled. YUI lets us load information on a node by node basis and this is critical to maximizing perceived performance in this case because, again, the likelihood of a user clicking on every single bird species in small. If the user clicks on a species in the tree view, we go fetch only the next node of information, and so on, and so on. Be lean on the wire.
Parting Shots
So here endeth the homily, go forth and develop some more. Have I hit all the critical points? Probably not. The field of usability and UX carries with it a substantial set of principles for buidling killer apps with great interfaces and my periodic usability rants are less a codex and more an appeal to the wider development community to continue to hold web GIS at arms length and continue to the march toward more highly performant, usable, focused applications. The take away from all this should be that we, as a community, need to focus more effort on providing our user base with relevant information right now, and less effort on flexing our GIS muscles by seeing how much crap we can cram into a browser.
From Our Homepage
Saying Farewell to an Amazing Journey
Communicating with Maps
Is There a GIS Career Ladder?
What does it mean to be geospatially smart? Series
Ways Real Estate and Property Developers Utilize Melissa GeoData for Data-Driven Decisions
Unlocking Value From Daily Satellite Imagery and Insights
Maximizing the Value of Your Address Data with Geo Addressing
How Indoor Mapping Enhances the Security of Smart Buildings
Look Ahead: AI, Location Intelligence and Efficiency
Collaboration Takes on Sea Level Rise & Dynamic Technology Environments
Brownies for Brownfields
Has Everything Been Mapped Already?
How Is Data Literacy Changing in an Artificial Intelligence Landscape
Portfolios for GIS Professionals: More Than Just Maps
How to Create a Distance Matrix in QGIS - A Step-by-Step Guide
7 Ideas for Bringing GIS into the K-12 Classroom
The Geography of Movement