Here we have selected seven different maps and images from the book to show the diversity of views of cyberspace.
Mapping the Net : Beginnings
(Courtesy of the Internet Archive)
One of the earliest surviving maps of the nascent ARPANET, the forerunner of the Internet, shows the first four operational nodes on the network at the end of 1969.The network connected computers at the University of California Los Angeles (UCLA) and Santa Barbara (UCSB), University of Utah, and the Stanford Research Institute.The 'map' is a hand-drawn black and white sketch by one of the network engineers and is reminiscent of 'back-of-the-envelope' wiring diagrams.The sketch is now a significant visual record as it marks an important development in the early history of computer networking.
Further information: The Internet Archive's ARPANET collection, http://www.archive.org/arpanet/
Mapping: Who Owns Internet Domain Names
(Courtesy of Matthew Zook)
Millions of Internet domain names are registered by companies and individuals across the world.Matthew Zook is analyzing the geography of dot.com domains.He produced a series of domain name maps, from the regional scale down to the street in a number of selected US cities.This example shows San Francisco using proportional blue circle symbols on the map to represent the number of domain names at each particular postal code.The densest concentrations are in the financial district and 'South of Market' area - famed as the Multimedia Gulch.
Further information: http://www.zooknic.com/
Visualising the Web Structure in 3D Hyperbolic Space
(Courtesy of Tamara Munzner and Paul Burchard)
In contrast to conventional Euclidean spaces, Tamara Munzner, then a graduate student at Stanford University, has investigated the potential of constructing 3D visualization of cyberspace in hyperbolic space.Hyperbolic space is an interesting type of fish-eye mathematical distortion that has 'more room' than Euclidean space - so more data can be displayed on the screen.Her work provides a novel way for exploratory visual browsing of the page-hyperlink structures of large Web sites.The structure of nodes and links is projected in hyperbolic space inside a ball, known as the 'sphere at infinity'.The user is able to manipulate the 3D Web graph, rotating and spinning it inside the sphere.
Further information: http://graphics.stanford.edu/papers/webviz/
'Show me the Money' - Mapping the Stock Market
(Courtesy of SmartMoney.com)
The Map of the Market shows the changing stock prices of over 500 publicly-traded companies on a single screen.Each tile represents a single company, with the area of the tile proportional to a company's market capitalization: the larger the tile, the greater the value of the company.The colour of the tile encodes the change in the company's stock price over a set time period: red represents a declining stock price, while green shows positive growth.Black indicates no change.The Map of the Market is fully interactive, allowing the user quickly to gain a sense of the overall market conditions, yet still see details on many hundreds of individual companies.
Further information: http://www.smartmoney.com/marketmap/
How Does Online Conversation Grow?
(Courtesy of Rebecca Xiong)
Cyberspace is full of conversations in chat rooms and on discussion boards.The problem of how to gain a sense of the social nature of discussion is difficult, particularly with conventional interfaces that just present a hierarchical listing of text messages.Rebecca Xiong's PeopleGarden is an interactive visual portrait of a conversation.Each garden represents a discussion list, each flower a person, and each petal a single message.The form and colour of the flower represents details on the number of messages posted, their temporal sequence, whether they were initial conversations or replies, and also the number of replies garnered in return from other participants.The overall growth of flowers in PeopleGarden can tell you much about the nature of the conversation.
Further information: http://smg.media.mit.edu/~becca/
Imagining the Inner Workings of the Internet
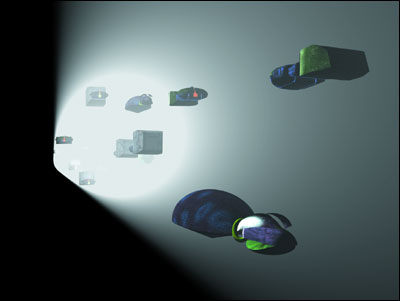
(Courtesy of Gunilla Elam)
Have you ever wondered what a data packet might actually look like as it zips through the Internet? If you wanted to explain this invisible, high-speed digital communications, it is useful to be able to visualize data packets, network links, routers and the like.Creating an imaginary, visual vocabulary to explain the inner workings of the Internet was the challenge tackled in the 1999 short animated film, Warriors of the Net, created by artist and animator Gunilla Elam and colleagues at Ericsson Medialab, Sweden.The Internet they imagine is a dank and grimy mechanical place with data packets being hulking, rusty steel trucks that speed through beams of light representing network channels.
Further information: http://www.warriorsofthe.net/
Ripping Up The Web
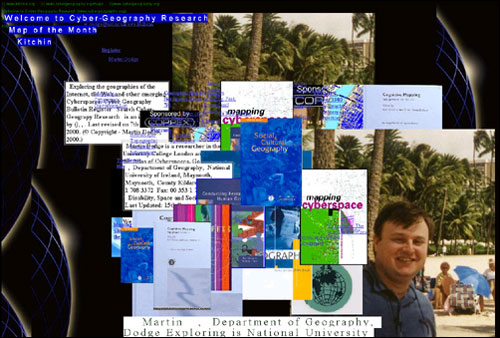
Artist Mark Napier has created an array of 'subversive' browsing tools that 'rip up' Web pages.Although he is not mapping the Web, he is providing a fresh view of cyberspace, a fractured Web of raw and random collages of text and images, undermining thoroughly the design pretensions of those who carefully create Web pages.Html code that is usually hidden is drawn in full view on screen and images are stretched and piled upon each other in a chaotic jumble.Napier's projects recognize that under the surface rendering presented in a browser, a Web page is a messy bunch of files, some of which are html code and scripts, and others are images and graphics.The example above is the result of RIOT, Napier's multi-user Web shredder, applied to Martin Dodge's and Rob Kitchin's homepages.
Further information: http://www.potatoland.org/pl.htm
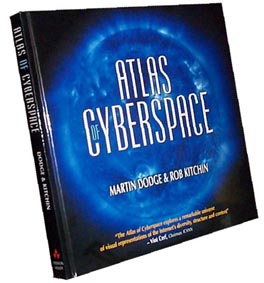
Atlas of Cyberspace
Addison-Wesley, published August 2001.HB, 268 pages.ISBN: 0201745755
Website: http://www.atlasofcyberspace.com/
Click here to buy
Martin Dodge works as a computer technician and researcher in the Centre for Advanced Spatial Analysis (CASA), at University College London.He maintains the Cyber-Geography Research web site at http://www.cybergeography.org, which includes the online version of Atlas of Cyberspace.With co-author Rob Kitchin, he has also written the books Mapping Cyberspace (Routledge, 2000) and Atlas of Cyberspace (Addison-Wesley, 2001).
Rob Kitchin is a senior lecturer in human geography at the National University of Ireland, Maynooth.He is the author of Cyberspace (Wiley, 1998) and the co-author of Mapping Cyberspace (Routledge, 2000) and Atlas of Cyberspace (Addison-Wesley, 2001).He has published three other books and is the general editor of the journal Social and Cultural Geography.