There's been a flurry of tools recently meant to
enable better sharing of data. The latest entry, WeoGeo, which is just coming out of
beta, adds an important twist: you can make money selling your data.
Moreover, if your data become embedded in a new product, you make
"royalties" too. Let's have a look.
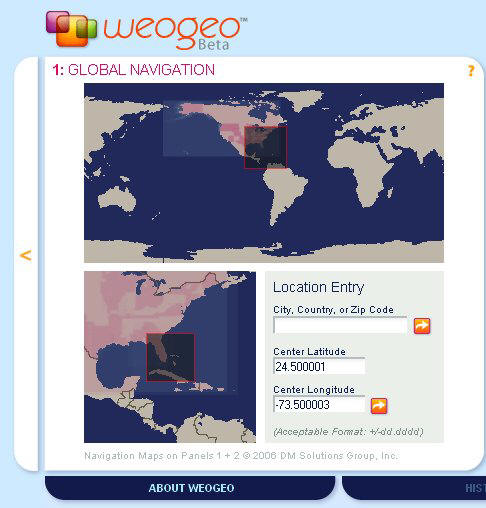
The first thing to note about WeoGeo is you may have to update your browser to use it. The application currently requires Internet Explorer 7+, Firefox 1.5+ or Safari 2+. There are "buyer" and "seller" pages. We'll look at the buyer interface. It's a six step/six panel process to find, explore and, if desired, purchase data. Step one involves determining the geography of the area of interest. Panel 1, Global Navigation, lets you drag a box around a world map or key in city, county or ZIP or a lat/long pair to serve as the center of the search (Figure 1).
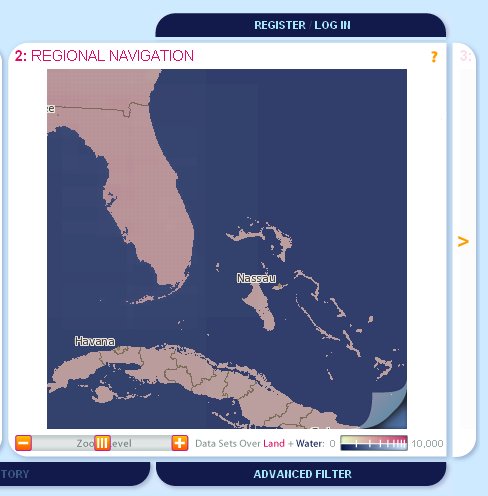
Panel 2 shows the regional detail. A slider allows real-time zoom and pan. (It's a "slippy map"!) The underlying technology for the map navigation/display is from DM Solutions. The "data maps overlay" highlights areas for which there are datasets. More intense reds (land) or blues (water) mean more datasets are available for the geography. You can optionally turn that information off using the "dog ear" on the bottom corner of the panel (Figure 2).
The Regional Navigation Panel
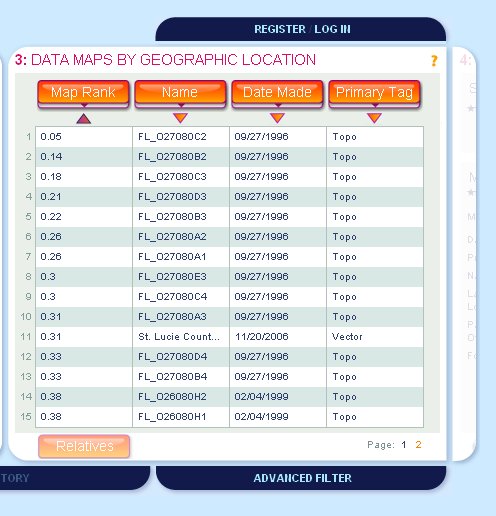
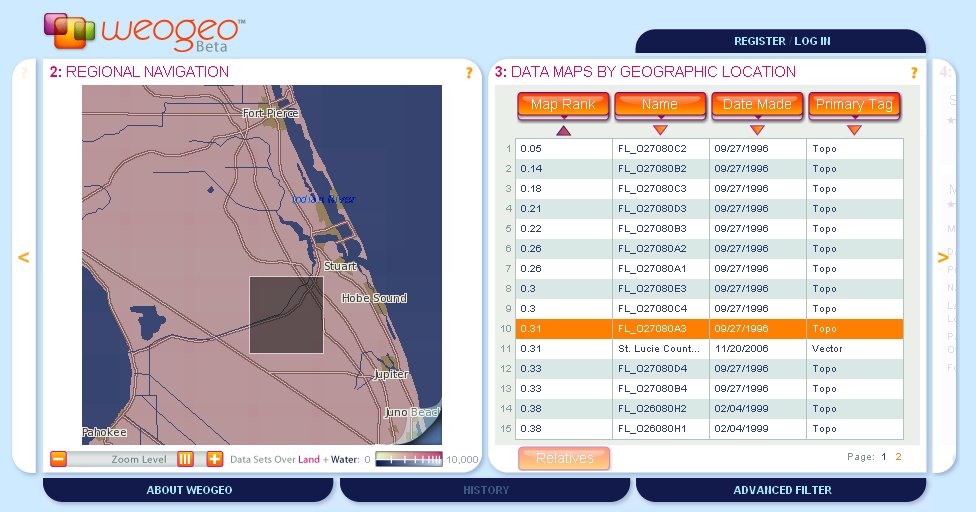
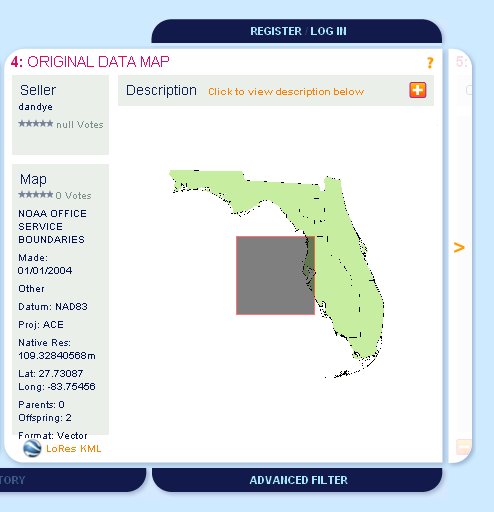
I've selected a data map in Florida. In panel 3 I can see the datasets available (Figure 3). There are currently two pages worth. You can sort the datasets by column, just as you would in Excel. Highlighting one map (one row) shows its extents on panel 2 (Figure 4). A dataset that's highlighted that has "relatives" will activate the "relative" button and allow you to see those datasets, too. “Parents†are maps from which the dataset was created; “children†are maps based on this dataset.
I selected a dataset about which I want to get more information. That appears in panel 4 (Figure 5). Here I see who is selling it, its date of creation, projection and parents, and offspring details. This comes from metadata provided by the seller. Ideally, this is FGDC metadata, which can be easily uploaded by the seller. There's also a star rating for both the seller and the map. These would be filled in if more people had purchased this particular map (the map rating), or other maps by this particular seller (the seller rating). Note, too, that this map has two children. At the bottom of the panel is the ability to access a low resolution KML file. That allows the user to check how well the dataset matches his existing data. It does not serve as a replacement of the offered dataset for it does not contain the detailed information in the actual dataset.
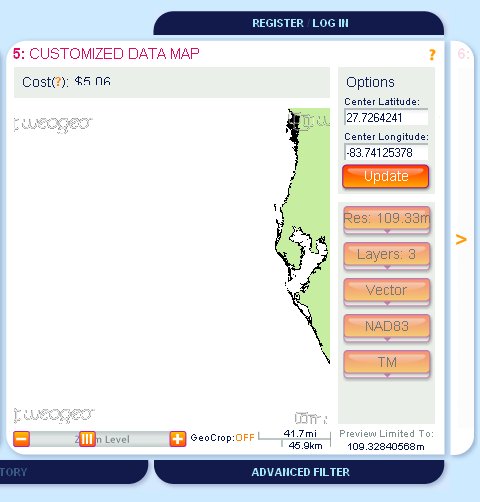
Panel 5 is where customization takes place – that is, clipping, re-projection and the like. For now, that's only available for raster data, not the vector dataset I selected. Further, it's the seller who determines how much customization is available. In my selection, a vector map, I see a preview and the cost. This map costs $5.06. To purchase the map I'd need to be logged in and then pay with a credit card. The dataset would then be created and I'd receive an e-mail describing where to pick it up. That method of delivery means that searches on the site are speedy because there's no waiting for map generation. Further, any processing is done via tools set up against Amazon's EC2 and S3 service and servers. That means many people could be searching for, customizing and ordering maps at once with virtually no degradation of performance.
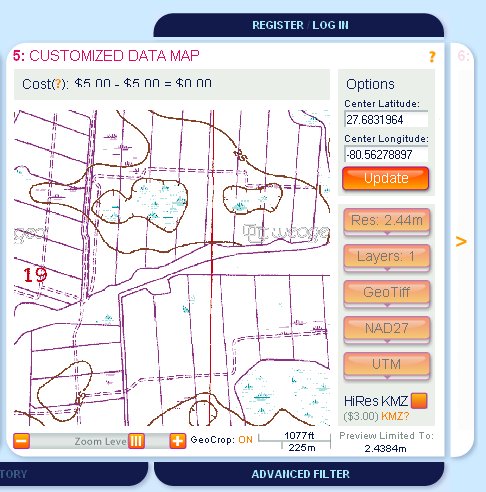
A raster map, in contrast to my vector map, can be customized. The user can zoom in to the area to be cropped and optionally request a high resolution KML file (extra fee) in addition to the file itself (Figure 7). The particular data I selected as an example, a digital raster graphic (DRG), are public domain and are made available for free by WeoGeo. Maps that are free may be obtained by registered users by selecting the Order Now button without entering any credit card information.
This is just the beginning for WeoGeo as it exists in private beta; WeoGeo expects to move into open beta by the end of the month, with additional enhancements expected in the coming months.
The first thing to note about WeoGeo is you may have to update your browser to use it. The application currently requires Internet Explorer 7+, Firefox 1.5+ or Safari 2+. There are "buyer" and "seller" pages. We'll look at the buyer interface. It's a six step/six panel process to find, explore and, if desired, purchase data. Step one involves determining the geography of the area of interest. Panel 1, Global Navigation, lets you drag a box around a world map or key in city, county or ZIP or a lat/long pair to serve as the center of the search (Figure 1).
Panel 2 shows the regional detail. A slider allows real-time zoom and pan. (It's a "slippy map"!) The underlying technology for the map navigation/display is from DM Solutions. The "data maps overlay" highlights areas for which there are datasets. More intense reds (land) or blues (water) mean more datasets are available for the geography. You can optionally turn that information off using the "dog ear" on the bottom corner of the panel (Figure 2).
 |
 |
The Regional Navigation Panel
I've selected a data map in Florida. In panel 3 I can see the datasets available (Figure 3). There are currently two pages worth. You can sort the datasets by column, just as you would in Excel. Highlighting one map (one row) shows its extents on panel 2 (Figure 4). A dataset that's highlighted that has "relatives" will activate the "relative" button and allow you to see those datasets, too. “Parents†are maps from which the dataset was created; “children†are maps based on this dataset.
 |
 |
I selected a dataset about which I want to get more information. That appears in panel 4 (Figure 5). Here I see who is selling it, its date of creation, projection and parents, and offspring details. This comes from metadata provided by the seller. Ideally, this is FGDC metadata, which can be easily uploaded by the seller. There's also a star rating for both the seller and the map. These would be filled in if more people had purchased this particular map (the map rating), or other maps by this particular seller (the seller rating). Note, too, that this map has two children. At the bottom of the panel is the ability to access a low resolution KML file. That allows the user to check how well the dataset matches his existing data. It does not serve as a replacement of the offered dataset for it does not contain the detailed information in the actual dataset.
 |
Panel 5 is where customization takes place – that is, clipping, re-projection and the like. For now, that's only available for raster data, not the vector dataset I selected. Further, it's the seller who determines how much customization is available. In my selection, a vector map, I see a preview and the cost. This map costs $5.06. To purchase the map I'd need to be logged in and then pay with a credit card. The dataset would then be created and I'd receive an e-mail describing where to pick it up. That method of delivery means that searches on the site are speedy because there's no waiting for map generation. Further, any processing is done via tools set up against Amazon's EC2 and S3 service and servers. That means many people could be searching for, customizing and ordering maps at once with virtually no degradation of performance.
 |
A raster map, in contrast to my vector map, can be customized. The user can zoom in to the area to be cropped and optionally request a high resolution KML file (extra fee) in addition to the file itself (Figure 7). The particular data I selected as an example, a digital raster graphic (DRG), are public domain and are made available for free by WeoGeo. Maps that are free may be obtained by registered users by selecting the Order Now button without entering any credit card information.
 |
This is just the beginning for WeoGeo as it exists in private beta; WeoGeo expects to move into open beta by the end of the month, with additional enhancements expected in the coming months.
From Our Homepage
Saying Farewell to an Amazing Journey
Communicating with Maps
Is There a GIS Career Ladder?
What does it mean to be geospatially smart? Series
Ways Real Estate and Property Developers Utilize Melissa GeoData for Data-Driven Decisions
Unlocking Value From Daily Satellite Imagery and Insights
Maximizing the Value of Your Address Data with Geo Addressing
How Indoor Mapping Enhances the Security of Smart Buildings
Look Ahead: AI, Location Intelligence and Efficiency
Collaboration Takes on Sea Level Rise & Dynamic Technology Environments
Brownies for Brownfields
Has Everything Been Mapped Already?
How Is Data Literacy Changing in an Artificial Intelligence Landscape
Portfolios for GIS Professionals: More Than Just Maps
How to Create a Distance Matrix in QGIS - A Step-by-Step Guide
7 Ideas for Bringing GIS into the K-12 Classroom
The Geography of Movement