Ancient, densely populated Bangalore, capital of the
State of Karnataka in Southern India, stands in sharp contrast to
Adelaide and South Australia which has a sparse, far flung population
covering nearly a million square kilometers.However, geographic and
cultural differences aside, the challenges of maintaining a clean,
reliable source of drinking water and modern wastewater treatment
facilities have far more similarities than differences in the cities'
respective use of GIS technology.
Bangalore's BISON is GIS Workhorse
The BISON (Bangalore Information Systems On Network), relative of the hardworking water buffalo, is an apt acronym for the Bangalore Water Supply and Sewerage Board's (BWSSB) GIS.The company is comprised of 60 service stations and five divisional offices, as well as its headquarters, and needed a comprehensive solution to its ever increasing information management demands.The company chose a complement of ESRI's ArcGIS software components to develop BISON, their asset management system, with the help of SCE Croatian.
According to the Additional Chief Engineer and Project Manager for the company's Water Audit and Control division, "BISON has three primary components: BISON Expert, BISON Lite and the Management Indicator Panel (MIP).Each component is highly specialized and together they form a powerful, detailed system that allows us to easily manage and maintain our water/wastewater network."
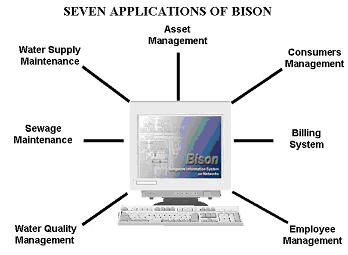
BISON Expert includes both GIS and MIS tools and is used to update and maintain the GIS database for the entire city.Applications include Asset Management, Water Supply Maintenance, Sewage Maintenance, Water Quality Management, Consumers' Management, Billing System and Employee Management.
BISON Light is used by BWSSB's service stations for consumer level issues, including new installations and complaints.It also maintains records for water supply and sewage system repairs and water sample results.Network information is also maintained by BISON Light, including the size, material and age of the pipes and their connections.
The Management Indicator Panel (MIP) forms the third part of the BWSSB's GIS and is used primarily to generate various monthly reports, which helps in the monitoring and management of the water/wastewater system.
The BISON GIS was developed between 1999-2002 and has been fully operational since 2003.The system is maintained by Genesys International Corporation Limited.The applications have been developed to suit the functional set up of the BWSSB, so the data naturally flows from the service stations and district offices to the company headquarters.ESRI's ArcSDE Enterprise GIS is used for spatial database management.Other ESRI software products in use include ArcInfo, ArcView, MapObjects Developer GIS and ArcPress.The applications generate and distribute consolidated results on a monthly basis in the form of reports and maps, reflecting the sound management of BWSSB. This facilitates evaluation of the policies implemented and keeps the members of the board, the principal decision makers, and the general public informed of the company's activities.Below are examples of six applications.
BWSSB is looking at new ways to collect and manage its data.This will include the use of handheld GPS devices and ArcPAD for quicker and more accurate data collection in the field.In addition, the company will start using photogrammetric techniques to create C- and L-section details for new project areas, which will help in the speedy implementation of those projects.Most importantly, they plan to make greater use of both the Internet and the Intranet through ArcIMS to allow the staff to view updated spatial data across the entire organization in near real-time.
Concludes the Chairman of BWSSB on the future of GIS at the company, "Customer service is very important to us and we currently use two methods to register complaints.One is the Interactive Voice Recording System (IVRS) and the other is the Online Complaint Management System (OCMS), our Web-based system.Both of these will soon be linked to our GIS so that we can more quickly identify the location of reported problems.In addition, this will provide us with a holistic view of the network and a better understanding of any problems, which will result in a quicker response and verification of the corrective actions taken."
AquaMap Provides Direction for SA Water
South Australia, the driest state in the world's driest inhabited continent, doesn't take water for granted.Local officials have an acute understanding that water is essential for agriculture and industry, not to mention human life.SA Water, the region's government owned water/wastewater utility company, realized nearly two decades ago that careful water management was essential and that GIS could provide the analytical and technological capabilities necessary to squeeze every drop from its meager water supply.The company was the first utility in Australia to fully capture and store its entire water and wastewater network on a GIS.
As a result, SA Water accumulated detailed data on more than 32,000 kilometers of water and wastewater mains, water and wastewater treatment plants, reservoirs, pumping stations, tanks, valves and even manholes and household drains.The data had also been integrated with the records of more than 800,000 land parcels and over one million digital images of pipe as constructed drawings.
Although the SA Water spatial database was rich in data, there was a great dependency on GIS experts to extract the information required for the ever increasing demand for data, products and services and could no longer meet key business requirements such as infrastructure planning, data editing and integration with other corporate systems.
The SA Water executive management endorsed a five-year GIS strategy to upgrade its GIS environment for the entire organization.The resulting implementation included procurement of new hardware and software, the migration of data, the implementation of new data edit and Web distribution applications and the development of applications to enable the integration of GIS with other corporate systems.
GIS software in SA Water's new operating environment includes ESRI's ArcGIS components ArcInfo, ArcView, ArcSDE, ArcIMS and the utility solution ArcFM.The new corporate GIS is used to capture, maintain, update and analyze all of the water and wastewater reticulation asset information throughout South Australia.This allows the company to easily get a snapshot of accurate and up-to-date information about the network and greatly improve its customer service.
Part of the implementation included AquaMap, a customized version of ESRI Australia's EView, which provides a spatial portal to other IT systems.AquaMap allows SA Water to seamless exchange information between its GIS, water quality, works management, water restrictions, property and plumbing audit systems.
With the implementation of AquaMap, SA Water staff members now have easy access to data from the desktop.This allows them to more efficiently access accurate and up-to-date data from the GIS and other corporate systems.This has resulted in significant productivity improvements.The application provides easy access to data for all users on the SA Water network, including regional offices and remote 'dial-up' users in country depots.No longer confined to the operational level, a wide range of staff throughout the organization is now using GIS, with over 700 staff members currently trained to use AquaMap.
John Maitland, Manager Spatial Solutions at SA Water, said "We can now easily check how our water and wastewater assets are performing and address areas of importance relating to customer service, operational management, economic development, investment and strategic planning. AquaMap's ability to integrate disparate corporate databases into one interface has excited a new generation of GIS users including managers, work planners, financial analysts and system analysts."
Bangalore's BISON is GIS Workhorse
The BISON (Bangalore Information Systems On Network), relative of the hardworking water buffalo, is an apt acronym for the Bangalore Water Supply and Sewerage Board's (BWSSB) GIS.The company is comprised of 60 service stations and five divisional offices, as well as its headquarters, and needed a comprehensive solution to its ever increasing information management demands.The company chose a complement of ESRI's ArcGIS software components to develop BISON, their asset management system, with the help of SCE Croatian.
According to the Additional Chief Engineer and Project Manager for the company's Water Audit and Control division, "BISON has three primary components: BISON Expert, BISON Lite and the Management Indicator Panel (MIP).Each component is highly specialized and together they form a powerful, detailed system that allows us to easily manage and maintain our water/wastewater network."
BISON Expert includes both GIS and MIS tools and is used to update and maintain the GIS database for the entire city.Applications include Asset Management, Water Supply Maintenance, Sewage Maintenance, Water Quality Management, Consumers' Management, Billing System and Employee Management.
 |
BISON Light is used by BWSSB's service stations for consumer level issues, including new installations and complaints.It also maintains records for water supply and sewage system repairs and water sample results.Network information is also maintained by BISON Light, including the size, material and age of the pipes and their connections.
The Management Indicator Panel (MIP) forms the third part of the BWSSB's GIS and is used primarily to generate various monthly reports, which helps in the monitoring and management of the water/wastewater system.
The BISON GIS was developed between 1999-2002 and has been fully operational since 2003.The system is maintained by Genesys International Corporation Limited.The applications have been developed to suit the functional set up of the BWSSB, so the data naturally flows from the service stations and district offices to the company headquarters.ESRI's ArcSDE Enterprise GIS is used for spatial database management.Other ESRI software products in use include ArcInfo, ArcView, MapObjects Developer GIS and ArcPress.The applications generate and distribute consolidated results on a monthly basis in the form of reports and maps, reflecting the sound management of BWSSB. This facilitates evaluation of the policies implemented and keeps the members of the board, the principal decision makers, and the general public informed of the company's activities.Below are examples of six applications.
 |
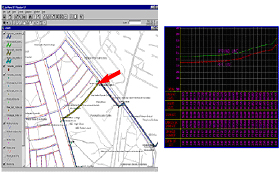 |
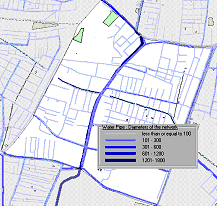
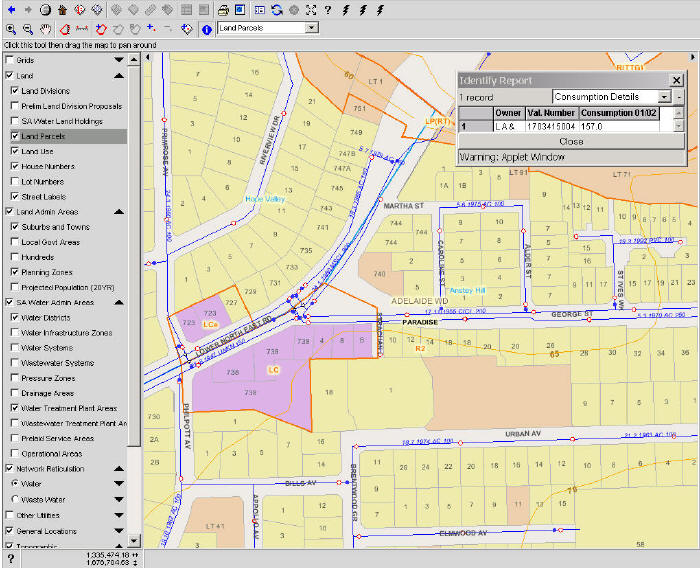
| Analysis of water network based on Dia of pipe in BISON Lite | Linking of corresponding L-section details of a sewer pipe |
 |
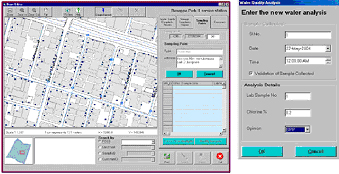 |
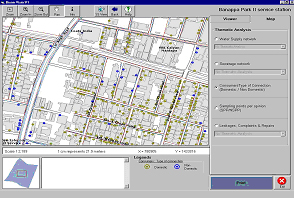
| Analysis of consumer connection patterns in BISON Lite | Water Quality sample details recorded in BISON Lite |
 |
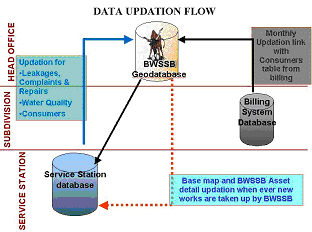 |
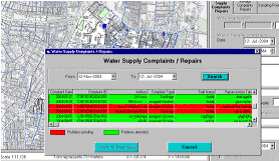
| Complaint Management & Maintenance work | Flow of information in BISON |
BWSSB is looking at new ways to collect and manage its data.This will include the use of handheld GPS devices and ArcPAD for quicker and more accurate data collection in the field.In addition, the company will start using photogrammetric techniques to create C- and L-section details for new project areas, which will help in the speedy implementation of those projects.Most importantly, they plan to make greater use of both the Internet and the Intranet through ArcIMS to allow the staff to view updated spatial data across the entire organization in near real-time.
Concludes the Chairman of BWSSB on the future of GIS at the company, "Customer service is very important to us and we currently use two methods to register complaints.One is the Interactive Voice Recording System (IVRS) and the other is the Online Complaint Management System (OCMS), our Web-based system.Both of these will soon be linked to our GIS so that we can more quickly identify the location of reported problems.In addition, this will provide us with a holistic view of the network and a better understanding of any problems, which will result in a quicker response and verification of the corrective actions taken."
AquaMap Provides Direction for SA Water
South Australia, the driest state in the world's driest inhabited continent, doesn't take water for granted.Local officials have an acute understanding that water is essential for agriculture and industry, not to mention human life.SA Water, the region's government owned water/wastewater utility company, realized nearly two decades ago that careful water management was essential and that GIS could provide the analytical and technological capabilities necessary to squeeze every drop from its meager water supply.The company was the first utility in Australia to fully capture and store its entire water and wastewater network on a GIS.
As a result, SA Water accumulated detailed data on more than 32,000 kilometers of water and wastewater mains, water and wastewater treatment plants, reservoirs, pumping stations, tanks, valves and even manholes and household drains.The data had also been integrated with the records of more than 800,000 land parcels and over one million digital images of pipe as constructed drawings.
Although the SA Water spatial database was rich in data, there was a great dependency on GIS experts to extract the information required for the ever increasing demand for data, products and services and could no longer meet key business requirements such as infrastructure planning, data editing and integration with other corporate systems.
The SA Water executive management endorsed a five-year GIS strategy to upgrade its GIS environment for the entire organization.The resulting implementation included procurement of new hardware and software, the migration of data, the implementation of new data edit and Web distribution applications and the development of applications to enable the integration of GIS with other corporate systems.
GIS software in SA Water's new operating environment includes ESRI's ArcGIS components ArcInfo, ArcView, ArcSDE, ArcIMS and the utility solution ArcFM.The new corporate GIS is used to capture, maintain, update and analyze all of the water and wastewater reticulation asset information throughout South Australia.This allows the company to easily get a snapshot of accurate and up-to-date information about the network and greatly improve its customer service.
Part of the implementation included AquaMap, a customized version of ESRI Australia's EView, which provides a spatial portal to other IT systems.AquaMap allows SA Water to seamless exchange information between its GIS, water quality, works management, water restrictions, property and plumbing audit systems.
 |
 |
With the implementation of AquaMap, SA Water staff members now have easy access to data from the desktop.This allows them to more efficiently access accurate and up-to-date data from the GIS and other corporate systems.This has resulted in significant productivity improvements.The application provides easy access to data for all users on the SA Water network, including regional offices and remote 'dial-up' users in country depots.No longer confined to the operational level, a wide range of staff throughout the organization is now using GIS, with over 700 staff members currently trained to use AquaMap.
John Maitland, Manager Spatial Solutions at SA Water, said "We can now easily check how our water and wastewater assets are performing and address areas of importance relating to customer service, operational management, economic development, investment and strategic planning. AquaMap's ability to integrate disparate corporate databases into one interface has excited a new generation of GIS users including managers, work planners, financial analysts and system analysts."
From Our Homepage
Saying Farewell to an Amazing Journey
Communicating with Maps
Is There a GIS Career Ladder?
What does it mean to be geospatially smart? Series
Ways Real Estate and Property Developers Utilize Melissa GeoData for Data-Driven Decisions
Unlocking Value From Daily Satellite Imagery and Insights
Maximizing the Value of Your Address Data with Geo Addressing
How Indoor Mapping Enhances the Security of Smart Buildings
Look Ahead: AI, Location Intelligence and Efficiency
Collaboration Takes on Sea Level Rise & Dynamic Technology Environments
Brownies for Brownfields
Has Everything Been Mapped Already?
How Is Data Literacy Changing in an Artificial Intelligence Landscape
Portfolios for GIS Professionals: More Than Just Maps
How to Create a Distance Matrix in QGIS - A Step-by-Step Guide
7 Ideas for Bringing GIS into the K-12 Classroom
The Geography of Movement