The Center
for Sustainable Innovation, based in Thetford Center, Vt., is a
non-profit that tackles "research, development, training, and
consulting for, and with, companies around the world interested in
managing and improving the sustainability of their operations." In
January 2009, the company announced Corporate Water Gauge, a solution
for measuring and reporting water use in the context of sustainability.
Executive Director Mark W. McElroy, Ph.D., answered our questions about
the offering and how GIS technology and data are involved, as well as
how you calculate measurements related to sustainability.
Directions Magazine (DM): What is the Corporate Water Gauge? It's not a product, not a piece of software, but a service?
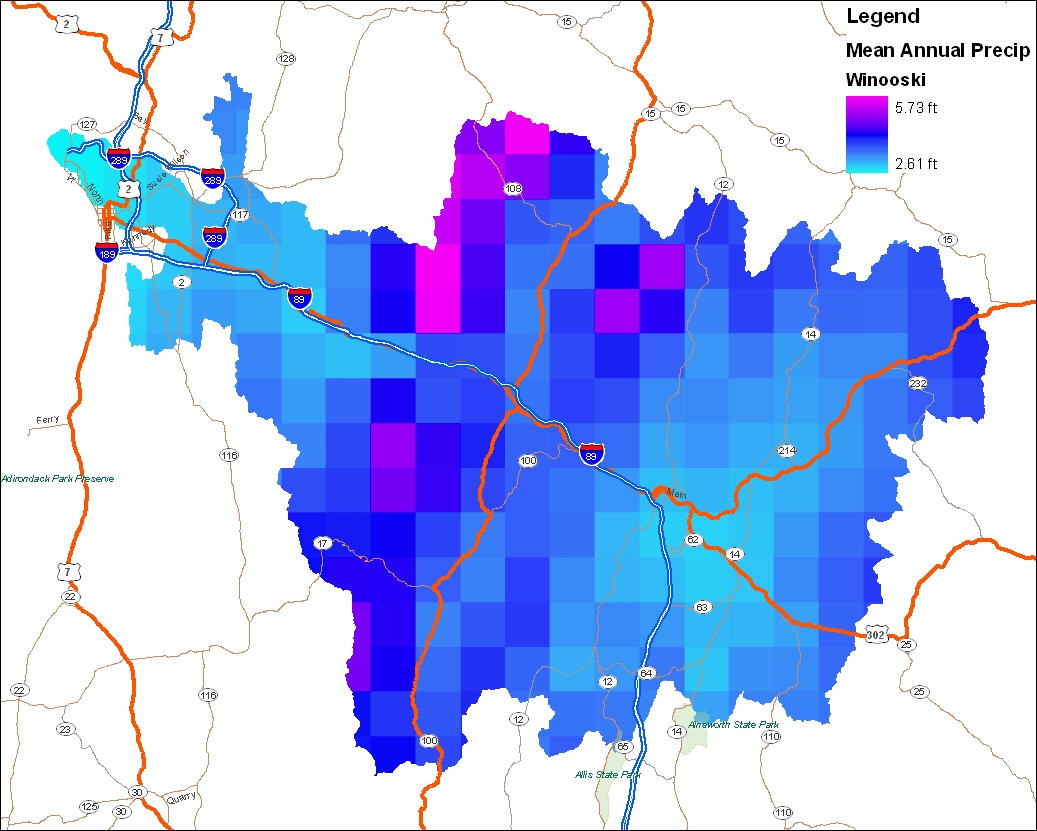
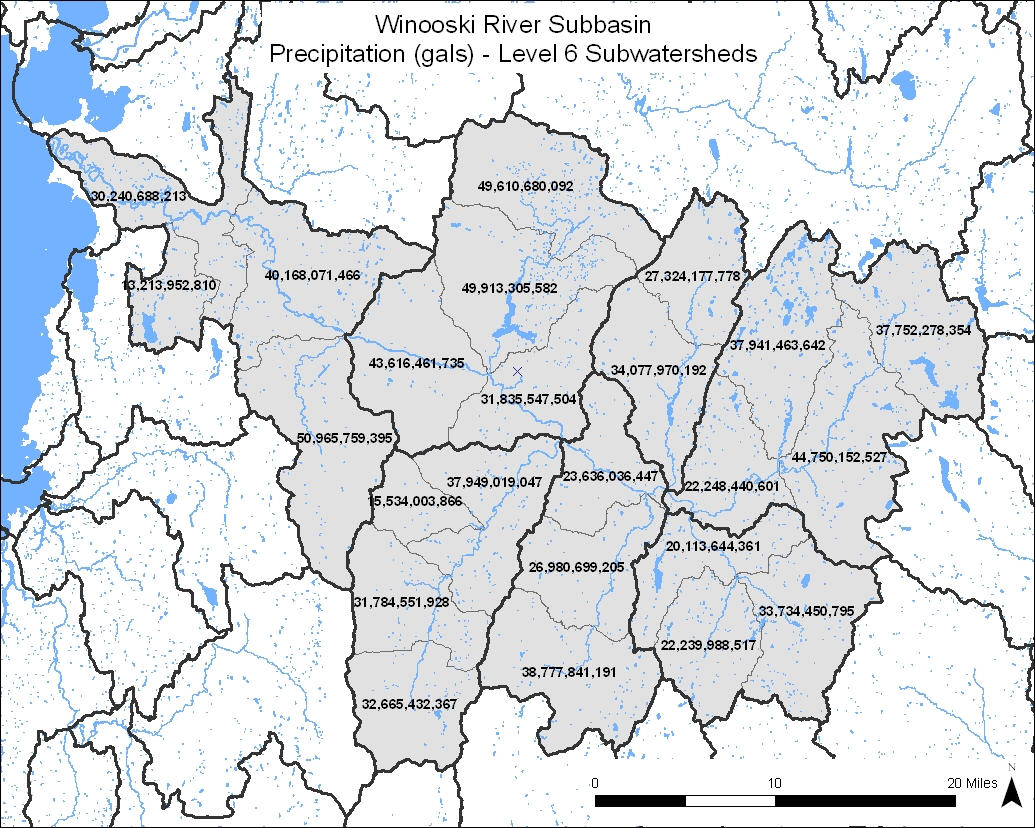
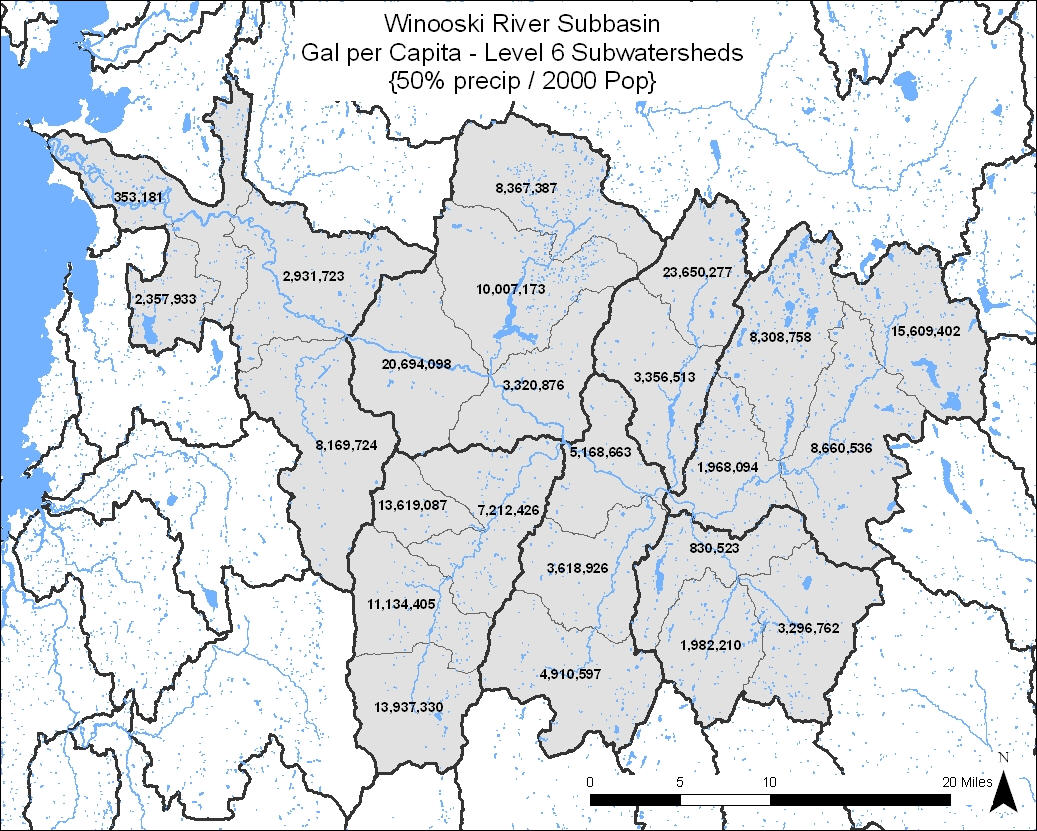
Mark McElroy (MM): The Corporate Water Gauge (CWG) is an integrated offering that consists of: (1) a water metric embodied in a spreadsheet; (2) a GIS tool for measuring water supply and use in watersheds; and (3) a consulting service for teaching and/or assisting with use of the whole package. Perpetual, non-exclusive licenses to use the CWG are granted free of charge to clients who first engage us to help them use the tool at a single site, or be trained (in-house) on how to use it themselves. (Minimum fees apply in either case.) After that, our clients are free to replicate and use the CWG as they see fit, with or without our assistance. (Note that in the latter case, clients must provide their own GIS and spreadsheet systems.) In sum, our primary deliverables at the conclusion of initial consulting and/or training engagements consist of: (1) a spreadsheet file which embodies the CWG metric (populated with site data, if applicable); (2) sample or actual graphical depictions of watershed areas (see Figures 1a, 1b and 1c on last page); (3) sample or actual GIS shapefiles: watershed data, census data and precipitation data; and (4) a methodology for using the CWG on a going forward basis.
DM: The Corporate Water Gauge is considered a sustainability quotient. What is a sustainability quotient and how does it differ from other measures of sustainability?
MM: A sustainability quotient is a general measurement model for expressing the sustainability performance of an organization (i.e. a general specification for organizational sustainability metrics). Denominators express impacts that an organization should or should not have on social and/or environmental conditions in the world (based on the size of the organization and what those conditions actually happen to be), and numerators express what an organization’s impacts on the same conditions have actually been. Other sustainability metrics are numerator-only in form. They report impacts on social and/or environmental conditions in the world, but fail to connect such impacts to actual social and/or environmental conditions in the world. They might tell us, for example, how much water a company has used at a particular site in the past year, while failing to report such use against relevant background conditions (such as, are water supplies in the relevant areas scarce or abundant?). Thus, unlike sustainability quotients, numerator-only metrics are context free. Full-quotient metrics, by contrast, put impacts in context. In that regard, they are much more useful and informative.
DM: Can you briefly explain the four pieces of information that go into calculating the Corporate Water Gauge quotient?
MM: The main ingredients are: (1) water inflows and outflows by source/sink per facility; (2) relevant watershed delineations; (3) precipitation volumes by watershed; and (4) facility population counts.
DM: What is the final product? A single value? A series of values for different geographic areas (local sustainability, regional, global)? A report?
MM: Sustainability quotients produce sustainability scores that can be plotted on a sustainability performance scale. In the case of the CWG, any score of less than or equal to 1.0 signifies sustainable performance (i.e., net water consumption is no greater than a company’s proportionate share of available renewable supplies). Obviously, net water use by facility is also reported. All such data can also be aggregated on a geographic or organizational basis. Blended scores in this regard are easily produced. Associated reports provide discussion and analysis of everything.
DM: How does GIS come into play in calculating and communicating results of a water use analysis? Can you share what technology is used? (Is this basically one big GIS analysis? It sounds as though it could be.)
MM: GIS plays a vital role in our method, but no more than the underlying metric does. Indeed, the metric, which is embodied in a spreadsheet, takes data produced by GIS and computes the actual sustainability score. The computation it makes is complex, and is based on cutting-edge sustainability theory and practice, and international standards for measuring and reporting the sustainability of corporate water use. GIS simply allows us to initially compute available water supplies on a per capita basis in the watersheds of interest. To do this, we are using a standard configuration of ArcGIS and a broad range of datasets.
DM: What are your data sources and how "fine grained" are they? The product PDF references census data - how new? Where does the precipitation data come from? Is it an average of time? Over what geographic area?
MM: Not surprisingly, this varies by location. Thus, we approach it on a case-by-case basis, although multi-site solutions at the country level are liable to be fairly consistent. Analyses are confined to relevant levels of watershed analysis, the determination of which is a step in our method.
DM: What sort of organizations are target users for the Corporate Water Gauge?
MM: Any organization, with one or more sites, that uses water resources and is faced with the need to manage, mitigate or report such use can benefit from this tool. Corporate sustainability managers, plant or facility managers, environmental managers, or anyone charged with managing and reporting corporate water use in any way should consider it. While other tools might do a reasonably good job of measuring net water use, the CWG takes measurement to the next level and measures use against available supplies, thereby producing context-based sustainability measures, as well. Corporate sustainability managers familiar with the Global Reporting Initiative (GRI) will find the CWG particularly helpful.
Directions Magazine (DM): What is the Corporate Water Gauge? It's not a product, not a piece of software, but a service?
Mark McElroy (MM): The Corporate Water Gauge (CWG) is an integrated offering that consists of: (1) a water metric embodied in a spreadsheet; (2) a GIS tool for measuring water supply and use in watersheds; and (3) a consulting service for teaching and/or assisting with use of the whole package. Perpetual, non-exclusive licenses to use the CWG are granted free of charge to clients who first engage us to help them use the tool at a single site, or be trained (in-house) on how to use it themselves. (Minimum fees apply in either case.) After that, our clients are free to replicate and use the CWG as they see fit, with or without our assistance. (Note that in the latter case, clients must provide their own GIS and spreadsheet systems.) In sum, our primary deliverables at the conclusion of initial consulting and/or training engagements consist of: (1) a spreadsheet file which embodies the CWG metric (populated with site data, if applicable); (2) sample or actual graphical depictions of watershed areas (see Figures 1a, 1b and 1c on last page); (3) sample or actual GIS shapefiles: watershed data, census data and precipitation data; and (4) a methodology for using the CWG on a going forward basis.
DM: The Corporate Water Gauge is considered a sustainability quotient. What is a sustainability quotient and how does it differ from other measures of sustainability?
MM: A sustainability quotient is a general measurement model for expressing the sustainability performance of an organization (i.e. a general specification for organizational sustainability metrics). Denominators express impacts that an organization should or should not have on social and/or environmental conditions in the world (based on the size of the organization and what those conditions actually happen to be), and numerators express what an organization’s impacts on the same conditions have actually been. Other sustainability metrics are numerator-only in form. They report impacts on social and/or environmental conditions in the world, but fail to connect such impacts to actual social and/or environmental conditions in the world. They might tell us, for example, how much water a company has used at a particular site in the past year, while failing to report such use against relevant background conditions (such as, are water supplies in the relevant areas scarce or abundant?). Thus, unlike sustainability quotients, numerator-only metrics are context free. Full-quotient metrics, by contrast, put impacts in context. In that regard, they are much more useful and informative.
DM: Can you briefly explain the four pieces of information that go into calculating the Corporate Water Gauge quotient?
MM: The main ingredients are: (1) water inflows and outflows by source/sink per facility; (2) relevant watershed delineations; (3) precipitation volumes by watershed; and (4) facility population counts.
DM: What is the final product? A single value? A series of values for different geographic areas (local sustainability, regional, global)? A report?
MM: Sustainability quotients produce sustainability scores that can be plotted on a sustainability performance scale. In the case of the CWG, any score of less than or equal to 1.0 signifies sustainable performance (i.e., net water consumption is no greater than a company’s proportionate share of available renewable supplies). Obviously, net water use by facility is also reported. All such data can also be aggregated on a geographic or organizational basis. Blended scores in this regard are easily produced. Associated reports provide discussion and analysis of everything.
DM: How does GIS come into play in calculating and communicating results of a water use analysis? Can you share what technology is used? (Is this basically one big GIS analysis? It sounds as though it could be.)
MM: GIS plays a vital role in our method, but no more than the underlying metric does. Indeed, the metric, which is embodied in a spreadsheet, takes data produced by GIS and computes the actual sustainability score. The computation it makes is complex, and is based on cutting-edge sustainability theory and practice, and international standards for measuring and reporting the sustainability of corporate water use. GIS simply allows us to initially compute available water supplies on a per capita basis in the watersheds of interest. To do this, we are using a standard configuration of ArcGIS and a broad range of datasets.
 |
 |
 |
DM: What are your data sources and how "fine grained" are they? The product PDF references census data - how new? Where does the precipitation data come from? Is it an average of time? Over what geographic area?
MM: Not surprisingly, this varies by location. Thus, we approach it on a case-by-case basis, although multi-site solutions at the country level are liable to be fairly consistent. Analyses are confined to relevant levels of watershed analysis, the determination of which is a step in our method.
DM: What sort of organizations are target users for the Corporate Water Gauge?
MM: Any organization, with one or more sites, that uses water resources and is faced with the need to manage, mitigate or report such use can benefit from this tool. Corporate sustainability managers, plant or facility managers, environmental managers, or anyone charged with managing and reporting corporate water use in any way should consider it. While other tools might do a reasonably good job of measuring net water use, the CWG takes measurement to the next level and measures use against available supplies, thereby producing context-based sustainability measures, as well. Corporate sustainability managers familiar with the Global Reporting Initiative (GRI) will find the CWG particularly helpful.
From Our Homepage
Saying Farewell to an Amazing Journey
Communicating with Maps
Is There a GIS Career Ladder?
What does it mean to be geospatially smart? Series
Ways Real Estate and Property Developers Utilize Melissa GeoData for Data-Driven Decisions
Unlocking Value From Daily Satellite Imagery and Insights
Maximizing the Value of Your Address Data with Geo Addressing
How Indoor Mapping Enhances the Security of Smart Buildings
Look Ahead: AI, Location Intelligence and Efficiency
Collaboration Takes on Sea Level Rise & Dynamic Technology Environments
Brownies for Brownfields
Has Everything Been Mapped Already?
How Is Data Literacy Changing in an Artificial Intelligence Landscape
Portfolios for GIS Professionals: More Than Just Maps
How to Create a Distance Matrix in QGIS - A Step-by-Step Guide
7 Ideas for Bringing GIS into the K-12 Classroom
The Geography of Movement