The golden rules for creating a successful shopping center - have a good location and strong anchor store - don't always apply in today's retail environment. Instead, the smallest nuances in a market can make or break a business. Unfortunately, absorbing and understanding research data can be difficult, as Midwestern shopping center owner United Properties (UP) found out.
The company provides a wealth of research to its leasing agents to help them develop critical insights into their trade areas. Too often, however, the agents didn't understand how best to leverage this information. "Giving a 300-page binder of data to our leasing agents just wasn't proving effective," says John Breitinger, vice president of NorthMarq, a sister company of UP.
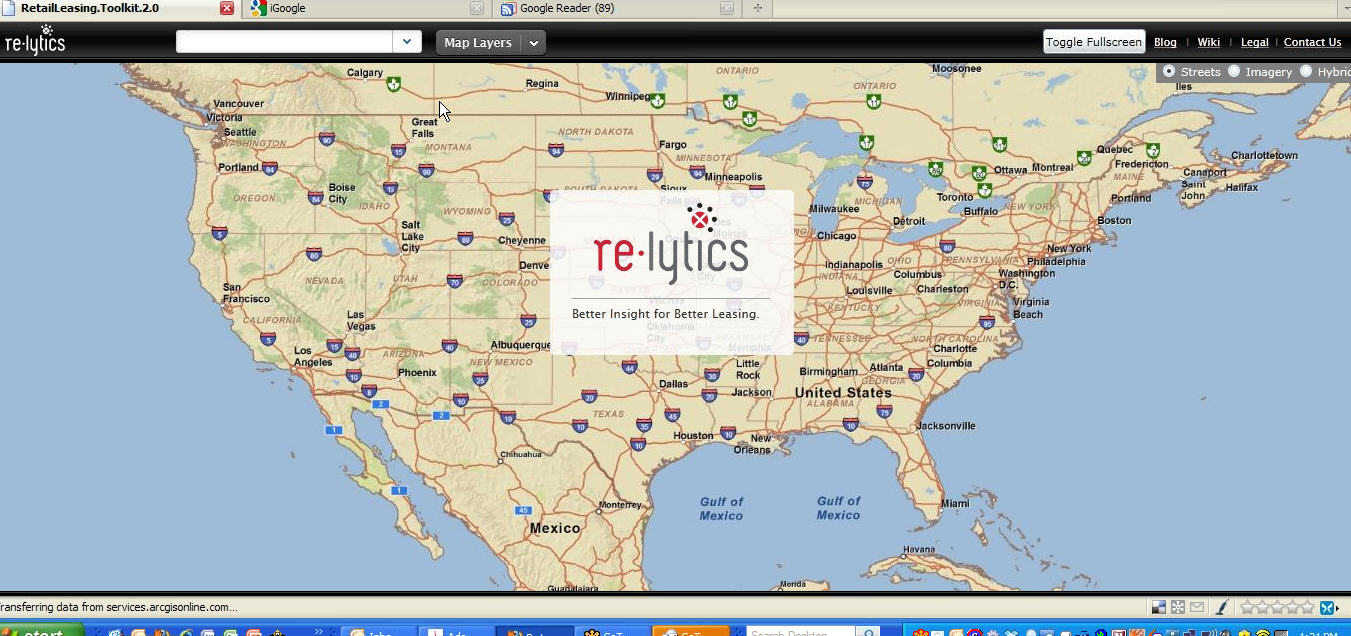
United Properties, the owner of 20 shopping centers in the Midwest, with its sister company and leasing agent NorthMarq, a provider of a full range of commercial real estate services nationwide, embarked on the creation of an innovative use of existing research, GIS technology, and location analytics to improve the companies' success in leasing vacant space. The outcome is re-lytics, a program offering proprietary research, analytics, and a Web-based toolkit that supports both leasing and asset management. Development of the Web-based program came from Inetium, a Gold Certified Microsoft Partner and sister company.
 |
The original goal of the program was to find a better way to provide leasing agents and asset managers with a tool that would help them develop the critical insights needed to target and engage the best prospects for their space, then put together presentations to help prospects visualize the opportunities.
After reviewing several options, the companies' team chose Esri ArcGIS Server,ArcGIS Mapping for SharePoint and the Business Analyst Online API to provide access to the geographic datasets, internal information, and assessment tools that agents need to do their jobs, as well as a secure site to collaborate and share information.
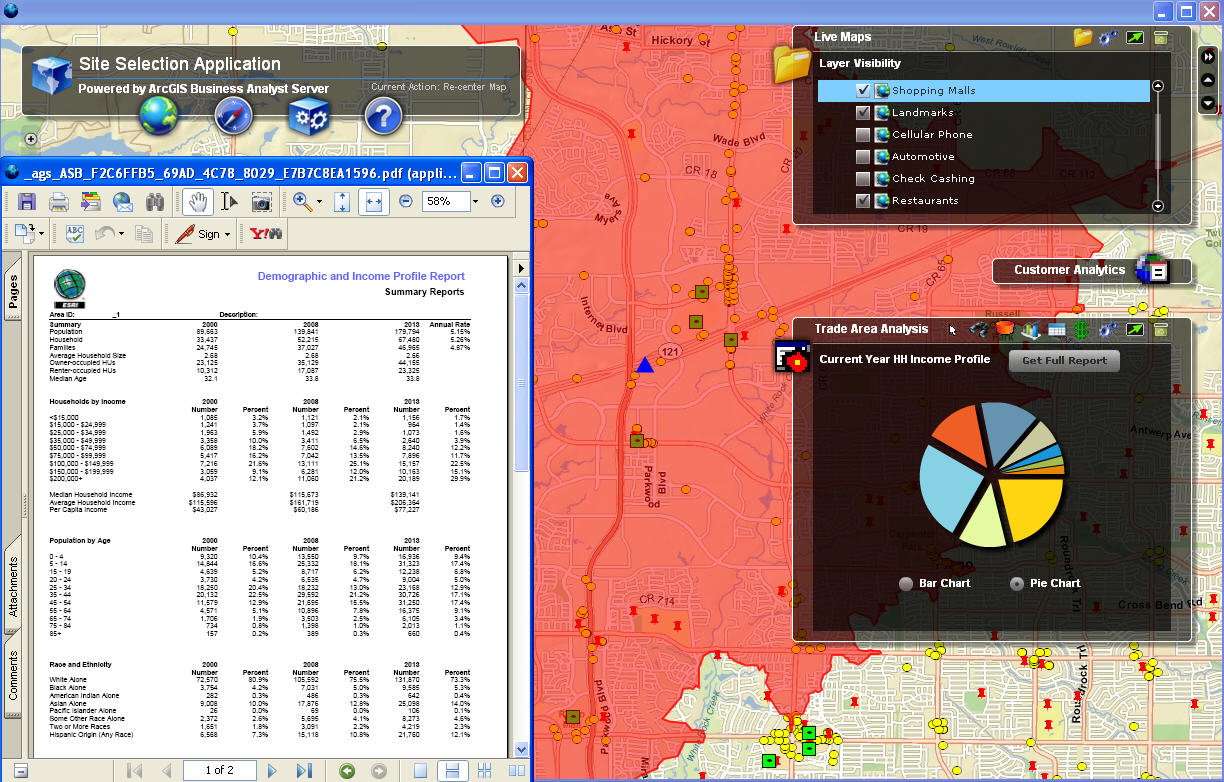
ArcGIS Server provides an enterprise GIS platform for UP and NorthMarq. ArcGIS Mapping for SharePoint is a set of configurable mapping components that allows SharePoint users to embed an interactive map within an existing Microsoft SharePoint site. The Business Analyst Online API gives the company the ability to create custom Web applications that include demographic data reporting capabilities. The team uses geographic data from ArcGIS.com, a site that connects users to maps, information, and tools published by Esri and other ArcGIS users. With the software and data, leasing agents can now see all the information they need on a map to help their clients find the most appropriate space.
The re-lytics program surveys and assesses more than 134 categories of goods and services in each shopping center trade area. Using ArcGIS, the data can be organized by category to determine spending potential, competitive dynamics, and consumer preferences for every category of retail goods and services in the marketplace. The program is a quick and simple evidence-based approach since, as Breitinger points out, "even the best insights are not useful if they aren't easy to use."
 |
 |
15 Minutes to a Great Site
One component of re-lytics is a 15-minute tactical analysis. Users employ the tools to quickly assess the market potential for a particular business, evaluate existing competition, and create custom marketing materials including a comparison report that puts everything in context for a prospect. An agent begins by reviewing consumer spending and market potential reports to get a feel for the market potential. Next, the agent uses the map-based tools to review current competition and property availability and see spatial relationships. The agent makes comparisons by selecting the trade areas to be compared by creating either a custom polygon, a radius around an address, or a drive-time distance around an address. Next, the agent selects the categories that need to be considered for that particular retailer, such as key demographics, consumer expenditure and employment information. A report is generated and made into an Excel spreadsheet. It only takes a few minutes for the agent to add information and a local perspective, such as anchor store and traffic information. A report like this is used to compare a retailer's existing sites to potential sites.
 |
"We were able to provide custom materials to support each pitch, including comparison reports and very useful maps," asserts Breitinger. "This was a breakthrough in providing context for every decision. We are all overwhelmed with data. We have found GIS to be a rich platform to aggregate information from many sources and create much better insights and visualizations. This has resulted in more customer engagements and much more substantive discussions."
Agents are finding that viable tenants have so many alternatives today that it is difficult to get their attention. With the new ability to depict the market potential of a prospective site in comparison with every other site where a prospect had actual history and experience, agents can engage prospects in discussions. This provides information on what the tenants need to succeed. This feedback is critical in a rapidly changing environment.
According to Breitinger, property owners, asset managers, and leasing agents are empowered by using the SharePoint site to work together in real time. The technology provides a good platform for sharing data and allows experience, knowledge and skill to be transferred through human interactions.
"Embedding our GIS system within a SharePoint environment has allowed us to pull in and coordinate a variety of diverse perspectives in a very efficient way," says Breitinger. "The owner, market analyst, leasing agent and tenant all bring meaningful insights that are quickly disseminated and discussed. This creates an advantage in observation and orientation in a rapidly changing market, enabling a much higher tempo in decision making and execution. This process also creates a cycle of learning by constantly providing real-time feedback. The re-lytics program has definitely made us more effective."