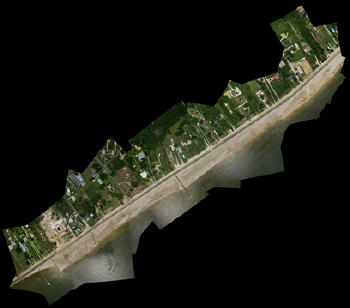
In late April 2010, the Deepwater Horizon oil rig exploded and sank, initiating what may be one of the worst environmental disasters in U.S. history. As the spill grew in size, the authors collaborated with the Louisiana Bucket Brigade, a New Orleans-based environmental non-profit group, and began a volunteer-led aerial mapping project to document the spill’s effects. The maps use orthorectified photographs of key affected sites processed into GeoTIFFs and tiled map services (TMS). The public domain photographs, taken from balloons or kites, are among the highest resolution imagery available of the spill.
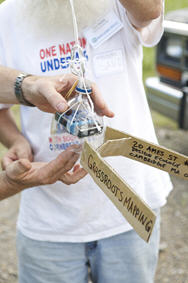 |
The mapping kits themselves, assembled for less than $300 each, consist of:
- an 8-foot weather balloon
- a tank of helium
- 2000 feet of string
- an inexpensive, consumer-grade digital camera
- half of a soda bottle
- a large kite
- GPS logger (optional)
Participants, who continue even today to produce new datasets, visit an affected area, fill a balloon or prepare a kite depending on wind conditions, and send the camera in its homemade protective enclosure up to 2000 feet in the air. By walking along the beach or moving in a boat, several kilometers of coastline may be imaged in just a few hours. Some maps approach the 2-3 cm nominal resolution, making it possible to count birds, plants and other features, and even identify bird species when compared with ground imagery.
 |
The oil spill provided an opportunity to apply the low-cost mapping techniques refined and documented by the authors over recent months to a real-world problem of immediate importance. By taking a neogeographic approach to aerial imaging with consumer off-the-shelf hardware and software, open-source GIS, and crowd-sourced field mapping techniques, they have regularly produced maps of a variety of oil-affected sites without great cost. Aerial imagery is collected by ground-based kite and balloon operators. This allows for on-demand data collection, specifically, choice of time and resolution (altitude). While many overflights took place, no publicly available, orthorectified imagery was available in the initial weeks of the spill. Up-to-date imagery was supplied mainly by the MODIS (Moderate Resolution Imaging Spectroradiometer) sensors aboard NASA's Terra and Aqua satellites, at a resolution of 250m.
Between May 7 and July 22, dozens of participants made 36 trips to gather mapping data, averaging almost one trip every other day. While only one trip failed to return with imagery, 56% of the trips returned with "excellent" or "usable" data, and over 11,000 images have been taken, with plans and funding in place to continue mapping through January 2011.
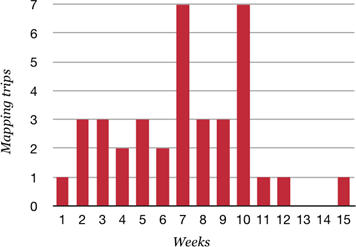 |
Image Processing
The low altitude aerial imagery is processed into orthomosaic raster datasets through digital image orthorectification (stitching) techniques. While automated processes have been tested with limited success, the variety in angle, resolution and distortion of source imagery presents challenges for such approaches, and in field testing they have yielded poor results. Such automated processes typically require a tighter precision. As a result, two different manual processing methods have accounted for the bulk of the mapping for Grassroots Mapping grassrootsmapping.org to date: Cartagen Knitter and Gonzo Earth Image Processing.
Gonzo Earth Image Processing is a proven workflow of different commercial off-the-shelf (COTS) and open-source GIS and digital image software packages, which has been used to generate dozens of maps from balloons, kites and both remote controlled and manned aircraft. In a process similar to classical "rubber sheeting," images are stitched into an orthomosaic that is either rectified from pre-existing imagery or from ground control points captured using a hand-held GPS device at the time of capture. Images are rescaled, rotated, distorted and warped as needed to conform to the base data during the rectification process. When the resultant mosaic image is complete, it is saved in the TIFF image format for GIS publication with the open-source Geographic Data Abstraction Library (GDAL).
The Cartagen Knitter, which employs a similar manual orthorectification process, is an attempt to make the map stitching process easier and more inclusive. It consists of a free Web-based interface where users may upload imagery and rectify that imagery from any modern Web browser. The Cartagen Knitter can also be configured to run offline in areas of poor Internet access. It allows multiple users to collaborate in real-time on the same map, speeding the stitching process. The open-source codebase is built on GDAL as well as the Cartagen vector mapping framework are available.
Both techniques produce standards-compliant output formats including GeoTIFF and TMS. This makes it possible to use the imagery to derive vector outlines of map features for use in, for example, OpenStreetMap, or to embed such maps in the popular crisis-response reporting tool, Ushahidi. In a parallel mapping project in the country of Georgia, Grassroots Mapping techniques were used alongside more traditional GPS-based approaches by the OpenMapsCaucasus.org effort to produce a public domain map of the entire country. In one particularly successful application, a series of balloon and kite flights were used to capture data of an entire city a dataset covering over five square kilometers at a resolution of 21cm.
While the geographic extent of captured imagery cannot rival that of either NASA MODIS or NOAA overflight imagery, it can be performed at low cost by independent groups, and it offers very high resolution for specific sites. As access to timely and high resolution pre- and post-disaster aerial imagery poses increasing challenges to the growing crisis response community, such techniques put the tools for data capture in the hands of a broader set of participants, bypassing licensing and cost bottlenecks. During the Haiti and Chile earthquakes, and currently in the Pakistan flood crisis, commercial licensing terms have obstructed the use of available datasets. In the absence of a sustainable mechanism to encourage open sharing of aerial imagery in times of crisis, the Grassroots Mapping toolset offers an alternative means of capturing such critical information.
Our choice of a blanket public domain policy means that, with the exception of some donated imagery, all our data are released into the public domain and may be downloaded and republished without permission. They are available in full. We expect this to facilitate the adoption of these data by researchers, litigators and other activists, just as has occurred in the media. Already, images have been republished by The Boston Globe, The New York Times, and many other news agencies. Much of the data have even been licensed to Google for use in the Google Earth and Google Maps products. This reversal - small organizations providing imagery to Google instead of the opposite - provides a solution to the challenges small organizations and individuals often encounter in acquiring satellite imagery.