How accurate is the imagery your vendor just delivered? Do you know? Spatial Informations Solutions (SIS) recently released Accuracy Analyst to answer that question. Directions Magazine
interviewed SIS President Chuck O'Hara to learn about the product and
its place in organizations on the receiving end of imagery data.
Directions Magazine (DM): What is Accuracy Analyst? Is it standalone software?
Chuck O'Hara (CO): Accuracy Analyst is a software solution for determining the locational accuracy of georeferenced image data that producers, government agencies and users around the world employ on a daily basis to create, update and refine vital map data and products. Accuracy Analyst runs on a typical PC desktop (Windows XP or higher) and provides a streamlined and high performance interface as well as an easily mastered workflow that enables users to evaluate enormous image data collections without requiring enormous resources or investment.
DM: SIS notes that "Accuracy Analyst is the first software solution to determine location errors in the image data used to produce maps." Can you further explain that? In particular, what kind of errors are identified?
CO: Accuracy Analyst provides standards-compliant quantification and direct understanding of the locational error in georeferenced image data. This error is the difference between locations of well-defined objects in the image and their actual location on the ground. Accuracy Analyst is the first software solution to quantify the locational accuracy of georeferenced image data. This software is easy to use and provides statistical results that are compliant with NSSDA [National Standard for Spatial Data Accuracy] standards to test accuracy to a 95% confidence level.
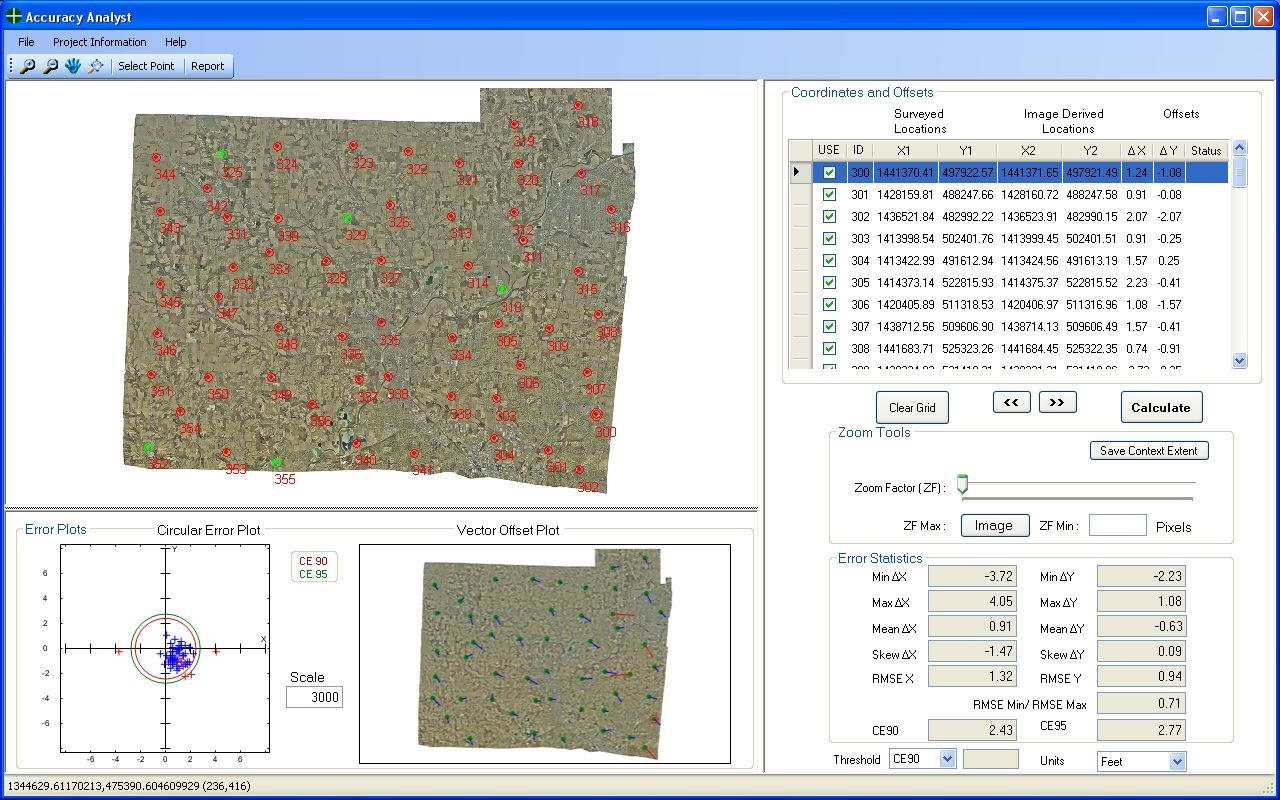
What this means is that Accuracy Analyst allows the user to input surveyed locations (at least 20 points - well-distributed points are recommended throughout the project area) that are visible on the base map images, automates the process of extracting and comparing photo-derived positions, and results are statistically analyzed to provide standards-compliant accuracy statistics. Accuracy Analyst also provides highly useful plots of circular error distribution (useful to show error patterns or bias) and a vector offset plot that shows the geographically varying nature of errors by vector arrows of direction and relative magnitude of errors across the study area. The combination of statistical results, tabular output and graphical plots deliver quantification and understanding. Accuracy Analyst also provides snapshots of each survey location and highlights the position of the survey location and the photo-identified location of each feature surveyed along with the coordinates for both locations and the amount of error at that location. All this information is concisely compiled into an output report that is date- and time-stamped and may be regenerated at any time. ï¿1⁄2
DM: What information about the imagery is needed to use the software? In what form should the imagery be?
CO: In order to perform an assessment of locational accuracy, it is vital to gather ground truth locations by a method that is at least three times more accurate than the stated accuracy of the image data being tested. Highly accurate survey checkpoint locations are an important part of any accuracy assessment and all checkpoints should be documented and field photos should be taken at all locations and organized to facilitate analysis of checkpoints and identification of features in the image data being evaluated.
To begin the analysis of image data accuracy, the user needs to know the format of the image data, the projected coordinate system and datum for the data, and the location of the data storage. The user also needs to have access to information about the data producer/vendor, the ground resolution of the image data, and should have information about the sensor used to collect the data. All of this information is entered into a few simple lines that provide documentation about the Accuracy Analyst project and are included in the final report printout.
Accuracy Analyst supports a wide variety of data types including the most common industry standard image formats. The most common image format is geoTiff. Accuracy Analyst also works on large mosaics that are usually available as compressed MrSID or ERMapper EZW formats. Accuracy Analyst currently supports multi-band and panchromatic image data with best results in 8-bit format data. Enhanced capabilities for designating colors (red, green and blue) for image band handling is being built into a "New Features Release" that will be available around the end of September.
DM: Is accuracy information for imagery typically delivered with the data from the provider? Is independent confirmation typically done by the recipient?
CO: Accuracy information is not typically delivered from providers other than in a letter or product documentation that describes the process used to create data and the typical accuracy that the production process delivers. Customers can place requirements for accuracy testing as well as "Independent Validation and Verification" of products, but in the past this has created significant costs and delays. With Accuracy Analyst, a set of survey checkpoints can be efficiently acquired and used within Accuracy Analyst to produce a full accuracy assessment quickly, concisely and in a unique manner that fully documents data accuracy and delivers easily comprehended results, meaning and understanding to the producer and the customer. Accuracy Analyst provides a standards-based common ground for delivering data products that enable confidence in delivery and acceptance of base map image data.
DM: How is accuracy information currently compiled?
CO: Accuracy information is currently compiled in an "all manual" process. Accuracy Analyst fully automates the process. Highly accurate survey checkpoint locations are an important part of any accuracy assessment. The current process considers the survey locations, compiles the X and Y coordinates into a spreadsheet, loads image after image into a conventional GIS, finds corresponding photo identifiable points, captures screen shots of point locations, takes the locations off of the GIS interface manually, puts the image-derived location on the spread sheet, and calculates the offsets for each survey checkpoint. When this has been completed for all the checkpoints and all offsets are calculated, accuracy statistics are calculated using the spreadsheet and results are compiled into an accuracy report. Using current methods, if the analyst wants to include photos, screen grabs of points, or information, it must all be done manually. Furthermore, using current methods, the data compilation, analysis and report generation process can take up to four or five days for a large photogrammetry project.
Accuracy Analyst does all of this automatically. It takes what has traditionally been a multi-day process and finishes it in as little as five to 10 minutes. Accuracy Analyst pays for itself in the first use and produces results that are far superior to any manual process. The return on investment is enormous considering the cost and time savings on every use of Accuracy Analyst.
Directions Magazine (DM): What is Accuracy Analyst? Is it standalone software?
Chuck O'Hara (CO): Accuracy Analyst is a software solution for determining the locational accuracy of georeferenced image data that producers, government agencies and users around the world employ on a daily basis to create, update and refine vital map data and products. Accuracy Analyst runs on a typical PC desktop (Windows XP or higher) and provides a streamlined and high performance interface as well as an easily mastered workflow that enables users to evaluate enormous image data collections without requiring enormous resources or investment.
DM: SIS notes that "Accuracy Analyst is the first software solution to determine location errors in the image data used to produce maps." Can you further explain that? In particular, what kind of errors are identified?
CO: Accuracy Analyst provides standards-compliant quantification and direct understanding of the locational error in georeferenced image data. This error is the difference between locations of well-defined objects in the image and their actual location on the ground. Accuracy Analyst is the first software solution to quantify the locational accuracy of georeferenced image data. This software is easy to use and provides statistical results that are compliant with NSSDA [National Standard for Spatial Data Accuracy] standards to test accuracy to a 95% confidence level.
What this means is that Accuracy Analyst allows the user to input surveyed locations (at least 20 points - well-distributed points are recommended throughout the project area) that are visible on the base map images, automates the process of extracting and comparing photo-derived positions, and results are statistically analyzed to provide standards-compliant accuracy statistics. Accuracy Analyst also provides highly useful plots of circular error distribution (useful to show error patterns or bias) and a vector offset plot that shows the geographically varying nature of errors by vector arrows of direction and relative magnitude of errors across the study area. The combination of statistical results, tabular output and graphical plots deliver quantification and understanding. Accuracy Analyst also provides snapshots of each survey location and highlights the position of the survey location and the photo-identified location of each feature surveyed along with the coordinates for both locations and the amount of error at that location. All this information is concisely compiled into an output report that is date- and time-stamped and may be regenerated at any time. ï¿1⁄2
DM: What information about the imagery is needed to use the software? In what form should the imagery be?
CO: In order to perform an assessment of locational accuracy, it is vital to gather ground truth locations by a method that is at least three times more accurate than the stated accuracy of the image data being tested. Highly accurate survey checkpoint locations are an important part of any accuracy assessment and all checkpoints should be documented and field photos should be taken at all locations and organized to facilitate analysis of checkpoints and identification of features in the image data being evaluated.
To begin the analysis of image data accuracy, the user needs to know the format of the image data, the projected coordinate system and datum for the data, and the location of the data storage. The user also needs to have access to information about the data producer/vendor, the ground resolution of the image data, and should have information about the sensor used to collect the data. All of this information is entered into a few simple lines that provide documentation about the Accuracy Analyst project and are included in the final report printout.
Accuracy Analyst supports a wide variety of data types including the most common industry standard image formats. The most common image format is geoTiff. Accuracy Analyst also works on large mosaics that are usually available as compressed MrSID or ERMapper EZW formats. Accuracy Analyst currently supports multi-band and panchromatic image data with best results in 8-bit format data. Enhanced capabilities for designating colors (red, green and blue) for image band handling is being built into a "New Features Release" that will be available around the end of September.
 |
DM: Is accuracy information for imagery typically delivered with the data from the provider? Is independent confirmation typically done by the recipient?
CO: Accuracy information is not typically delivered from providers other than in a letter or product documentation that describes the process used to create data and the typical accuracy that the production process delivers. Customers can place requirements for accuracy testing as well as "Independent Validation and Verification" of products, but in the past this has created significant costs and delays. With Accuracy Analyst, a set of survey checkpoints can be efficiently acquired and used within Accuracy Analyst to produce a full accuracy assessment quickly, concisely and in a unique manner that fully documents data accuracy and delivers easily comprehended results, meaning and understanding to the producer and the customer. Accuracy Analyst provides a standards-based common ground for delivering data products that enable confidence in delivery and acceptance of base map image data.
DM: How is accuracy information currently compiled?
CO: Accuracy information is currently compiled in an "all manual" process. Accuracy Analyst fully automates the process. Highly accurate survey checkpoint locations are an important part of any accuracy assessment. The current process considers the survey locations, compiles the X and Y coordinates into a spreadsheet, loads image after image into a conventional GIS, finds corresponding photo identifiable points, captures screen shots of point locations, takes the locations off of the GIS interface manually, puts the image-derived location on the spread sheet, and calculates the offsets for each survey checkpoint. When this has been completed for all the checkpoints and all offsets are calculated, accuracy statistics are calculated using the spreadsheet and results are compiled into an accuracy report. Using current methods, if the analyst wants to include photos, screen grabs of points, or information, it must all be done manually. Furthermore, using current methods, the data compilation, analysis and report generation process can take up to four or five days for a large photogrammetry project.
Accuracy Analyst does all of this automatically. It takes what has traditionally been a multi-day process and finishes it in as little as five to 10 minutes. Accuracy Analyst pays for itself in the first use and produces results that are far superior to any manual process. The return on investment is enormous considering the cost and time savings on every use of Accuracy Analyst.
From Our Homepage
Saying Farewell to an Amazing Journey
Communicating with Maps
Is There a GIS Career Ladder?
What does it mean to be geospatially smart? Series
Ways Real Estate and Property Developers Utilize Melissa GeoData for Data-Driven Decisions
Unlocking Value From Daily Satellite Imagery and Insights
Maximizing the Value of Your Address Data with Geo Addressing
How Indoor Mapping Enhances the Security of Smart Buildings
Look Ahead: AI, Location Intelligence and Efficiency
Collaboration Takes on Sea Level Rise & Dynamic Technology Environments
Brownies for Brownfields
Has Everything Been Mapped Already?
How Is Data Literacy Changing in an Artificial Intelligence Landscape
Portfolios for GIS Professionals: More Than Just Maps
How to Create a Distance Matrix in QGIS - A Step-by-Step Guide
7 Ideas for Bringing GIS into the K-12 Classroom
The Geography of Movement