The model that HydroQual has developed employs a network of cells, or a grid, overlaid onto the geographic region. This two-dimensional grid is then expanded to 3D by dividing the water column into ten distinct layers from the surface to the ocean bottom. The simulations of this area are for periods upwards of a year or more, for scores of hydrodynamic and water-quality parameters (e.g.dissolved oxygen, biochemical oxygen demand, chlorophyll content, etc.), calculated at a time-step 10 minutes or less, with the results saved on a daily or weekly basis. Thus, the engineer is faced with model output that varies in map-space, in depth, in time, with regard to multiple parameters. Ideally, the tool that provides an interface would allow the engineer to 'slice' the grid in any direction, for any given time, for any parameter of concern, and see the result mapped and graphed. In addition, time-series animation is a crucial tool for both analysis, and communicating results to the clients.
HydroQual has developed a proprietary system that is used in-house to plot data in myriad ways that are especially useful to our staff. We have also developed a visualization system to create and display animations, but it does not easily integrate GIS data, and it is not a full-scale data mining tool that would allow engineers to diagnose or present their model results. HydroQual has experimented with other GIS applications to meet these needs, but two elements always stymied our efforts: system performance; and the need to represent time-series data. Our current efforts with TatukGIS, using ADO technology, have eliminated these problems.
The philosophy behind the design of our new HydroQual Modeling System (HQMS) is to use off-the-shelf technology for each specialized task. Thus, the TatukGIS object library, in a Borland Delphi6 environment, provides us with all the tools we need to create standard GIS functionality that gives superior performance. These functions include:
- Read standard GIS data formats, especially shapefiles.
- Pan and Zoom on a map view, scale display
- Report map coordinates and local data in real-time
- Display registered images for context - satellite imagery, scanned nautical charts, etc.
- Create thematic legends with symbols, color, statistical intervals, etc.
- Arrange layer order, modify transparency of layers
- Label features with attributes
By storing our model output in an
.mdb object, and joining it to the shapefile using ADO objects, we were
able to place the burden of processing time-series data on the elements
that do it best, and then simply display the results in thematic maps and
graphs. The Delphi environment provides a powerful set of tools for
implementing a variety of section and transect graphing functions, all
based on ADO queries of the underlying database. Finally, by simply
altering the SQL strings, we were able to extract a series of data-views,
varying with time, and map them. The animation proceeds without screen
flicker, and all elements of the display, graphs, color, and labels, can
easily be made to vary in synchrony with the time-series data.
The images below give some sense of the versatility of the application:
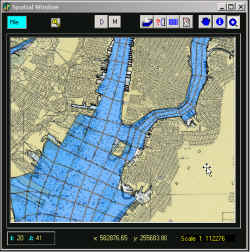 The image above shows a close-up view
of the New York Harbor, with the modeling grid superimposed over a NOAA
nautical chart. The grid has been made partially transparent so that
sounding data may be read for individual cells. Note the scale and
coordinate display at the bottom, and the reporting of cell (I, J)
values for each model cell. This is a crucial identifier for diagnosing
and calibrating all large water quality models.
The image above shows a close-up view
of the New York Harbor, with the modeling grid superimposed over a NOAA
nautical chart. The grid has been made partially transparent so that
sounding data may be read for individual cells. Note the scale and
coordinate display at the bottom, and the reporting of cell (I, J)
values for each model cell. This is a crucial identifier for diagnosing
and calibrating all large water quality models.
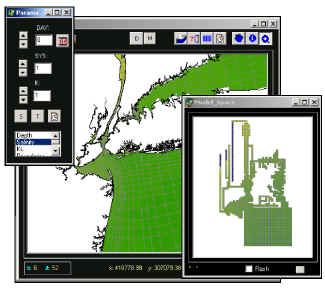 The images above show some of the versatility
of the display options available in this application. The general
view of the NYC region has been color-coded as a thematic map of salinity.
The model grid is displayed in real geographic space, and in model space
as the computer 'sees' it.(Salinity varies little, except in the estuarine
rivers, e.g.the upper reaches of the Hudson that appear blue in the map.)
The parameter control form can be used to alter the display so that salinity
at any model layer is displayed, and the values may be varied by time.
The form also allows the user to rapidly change the parameter being displayed
from a standard list box. With these tools, the analyst can quickly
map any variable, for any depth, for any time-period of interest.
(Running on a standard laptop computer, the system was able to map data
for an entire year's simulation without noticeable delay.)
The images above show some of the versatility
of the display options available in this application. The general
view of the NYC region has been color-coded as a thematic map of salinity.
The model grid is displayed in real geographic space, and in model space
as the computer 'sees' it.(Salinity varies little, except in the estuarine
rivers, e.g.the upper reaches of the Hudson that appear blue in the map.)
The parameter control form can be used to alter the display so that salinity
at any model layer is displayed, and the values may be varied by time.
The form also allows the user to rapidly change the parameter being displayed
from a standard list box. With these tools, the analyst can quickly
map any variable, for any depth, for any time-period of interest.
(Running on a standard laptop computer, the system was able to map data
for an entire year's simulation without noticeable delay.)
The image below shows how the system
can be used to select specific rows and columns of the model grid, mask
the others, and plot the values of the parameter of concern (e.g., depth,
DO, salinity, etc.) on accompanying graphs. The user can click the
arrow buttons to interactively move the transects up and down, left and
right: the plot follows suit.
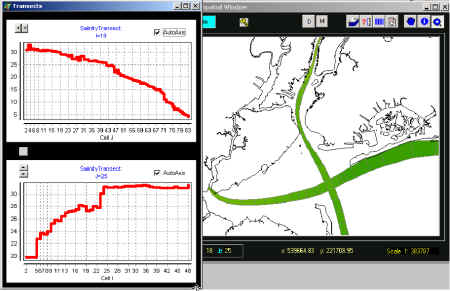 The very rapid response of the system
is achieved by employing SQL calls to the .mdb object to extract the required
data for the charts. The map window simply illustrates the areas
of interest, and can be used to interactively define them. A similar
technique is used to generate plots for any parameter that varies with
time by clicking on a single grid cell of interest. The plot below
shows the variation in salinity for the surface layer of a cell in the
lower Hudson River, with ten-day average values. The quality of the
graphics that are available in the Delphi environment far exceeds anything
we have seen in standard GIS packages.
The very rapid response of the system
is achieved by employing SQL calls to the .mdb object to extract the required
data for the charts. The map window simply illustrates the areas
of interest, and can be used to interactively define them. A similar
technique is used to generate plots for any parameter that varies with
time by clicking on a single grid cell of interest. The plot below
shows the variation in salinity for the surface layer of a cell in the
lower Hudson River, with ten-day average values. The quality of the
graphics that are available in the Delphi environment far exceeds anything
we have seen in standard GIS packages.
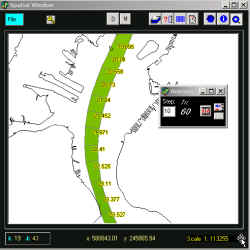
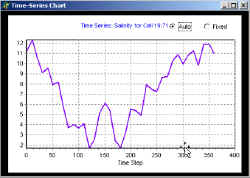 Finally, animation has always been a
serious tool for analysis and client communication on many types of HydroQual
projects. The image below shows the simple tool used to initiate
a one-year animation of the model results. Only a single transect
of interest is displayed, and both the thematic colors and the labels indicating
the numerical value of the parameter change with each time-step.
The user can select a parameter and a depth level, and then animate the
stored model results using any preferred time-step, e.g., one-day, ten-day,
one-month, etc. Needless to say, the ability to employ these tools
in conjunction with the standard GIS ability to display and select from
a wide variety of data, e.g., imagery, census data, water quality measurement
points, etc., makes for an extraordinarily rich data environment in which
to calibrate and fine-tune our models.
Finally, animation has always been a
serious tool for analysis and client communication on many types of HydroQual
projects. The image below shows the simple tool used to initiate
a one-year animation of the model results. Only a single transect
of interest is displayed, and both the thematic colors and the labels indicating
the numerical value of the parameter change with each time-step.
The user can select a parameter and a depth level, and then animate the
stored model results using any preferred time-step, e.g., one-day, ten-day,
one-month, etc. Needless to say, the ability to employ these tools
in conjunction with the standard GIS ability to display and select from
a wide variety of data, e.g., imagery, census data, water quality measurement
points, etc., makes for an extraordinarily rich data environment in which
to calibrate and fine-tune our models.