Location Intelligence technology doesn't just incorporate virtual
geography with real geography any more; it actually melds the two so
that views of one can be combined with the other.A product that does
this at what is perhaps the highest state of the art is Starlight,
produced by Battelle and the Pacific Northwest National Labs (PNNL).
Starlight, originally developed for the intelligence community, provides visual access to large amounts of data in a 3D.It also was designed for large collaborations in assessment and analysis.
Starlight ingests large quantities of data, required to be in Extensible Markup Language (XML) format, and generates stunning visualizations of structured values, conditioned with color and shape in a manner not that different from the symbology and thematics used in mapping.Starlight also supports natural language queries in a manner similar to Google or Yahoo.
In the image shown above, data is arranged by state and the concentrations of data relative to those geographies.As you would expect, you can zoom to a particular concentration and also see the attributes.For example, in the bottom of the sphere, near Kansas (KS) is a cluster that could represent the counties in Kansas by population, incidences of aircraft accidents, etc.Not all that different from a thematic map...
This image (below) shows data in a "Pan Tree."
Another view is the "Network View" (below).
Yet another view is the "Link Array" (below).
Finally, one other view is a total view showing a set of data relationships from the previous image tied to a real geography.
The required hardware is no different than a typical mapping or CAD workstation.Just the basics of a high-resolution video card, large hard drive and a reasonably fast processor.Starlight will also run on a server and is scalable relative to the needs and requirement of the user(s).
Software like this is not trivial to put in place, and requires a fairly high level of training to utilize at the level at which it was designed to operate.However, it appears that this technology could be used with typical corporate data sets (corporate sales or production data , for example), by a business geographer or a competitive intelligence professional.Battelle and the PNNL will sell the software outside the intelligence industry, but discourage a sale without installation and data source consulting, because they are concerned just acquiring the software will not result in a successful installation.
Starlight certainly expands the view of geography and perhaps offers an insight to skill sets that are in our future.Which is bringing together real, virtual and cyber geography into one 3- and 4-D workspace, performing better and more thorough analysis and ending up with far better results.
I had an opportunity to discuss Starlight with Brian Kritzstein, Principal Research Scientist, Information Visualization and Emerging Technologies, ITS Product line at Battelle Colonial Place Operations in Arlington, VA (part of The Battelle Memorial Institute).
First, a note about Battelle (from the Battelle Website):
Brian Kritzstein (BK): The Starlight team responsible for the creation of the application all reside in Richland, WA, where PNNL is located.With the inclusion of some commercial off-the-shell (COTS) products, the R&D team at PNNL worked on a way to combine all of their own IP with the functionality of the COTS components to produce a first in class information visualization tool.Originally, the idea of Starlight was born in the form of a "challenge" presented to the lab in which they were asked to come up with a way to visualize the locations of things on a map.Once this started to gain traction, folks at the lab expanded on the idea of visualizing that limited type of information and included other elements of data ...times, dates, unstructured text, etc.All of these elements combined made up what many of the document types are within the community that has funded the research and development of the product.That was about six to eight years ago.
HR: With any software that is comprised of several existing technologies, when those technologies are selected they are weighed by functionality, ease of integration and the robustness of the technologies themselves.What were some of the factors that conditioned the selection choices for these technologies within Starlight?
BK: ESRI, used for the mapping, is well regarded within the GIS community.CCM, the database technology from ATS is fast and works with large sets of data quickly.The TRUST engine (Text Representation Using Subspace Transformation) from Boeing Phantom Works is one of the better lead system integrator-based clustering algorithms.Also, we had used THINGFINDER from INXIGHT, in one of the earlier versions of Starlight for entity extraction.
HR: Starlight is a complex product and while it was probably immediately understood by it's original target audience, this might not be the case for commercial users.Marketing has got to be a particular challenge.How do you market Starlight and make it salient to commercial users and what have you created as the unique selling points?
BK: We tend to "market" Starlight at government trade shows and conferences, since that is the typical audience.Word of mouth is one of the biggest forms of marketing we have been successful with.Many times, the phone will ring and it's someone I've never talked to before.They may have gotten a hold of the Starlight video CD and have formed a laundry list of questions.We try to convey to folks the benefit that visualizing data can have.While you may not find the needle in the haystack, we can at least point analysts in the right direction for further analysis of a particular item of interest.
Starlight, originally developed for the intelligence community, provides visual access to large amounts of data in a 3D.It also was designed for large collaborations in assessment and analysis.
Starlight ingests large quantities of data, required to be in Extensible Markup Language (XML) format, and generates stunning visualizations of structured values, conditioned with color and shape in a manner not that different from the symbology and thematics used in mapping.Starlight also supports natural language queries in a manner similar to Google or Yahoo.
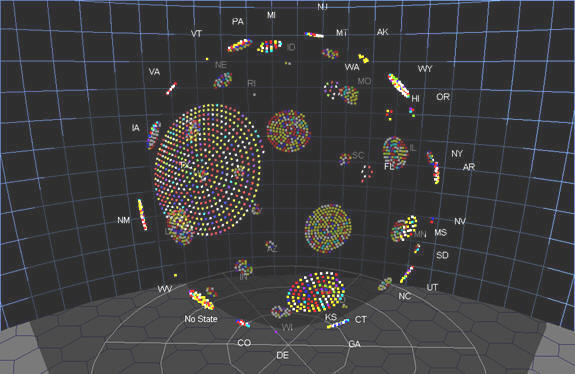 |
| A visualization workflow begins with all the data displayed as a data sphere.This shows a uniform view of data collections and their relationship by shape and color.(Source: Battelle) Click image for larger view. |
In the image shown above, data is arranged by state and the concentrations of data relative to those geographies.As you would expect, you can zoom to a particular concentration and also see the attributes.For example, in the bottom of the sphere, near Kansas (KS) is a cluster that could represent the counties in Kansas by population, incidences of aircraft accidents, etc.Not all that different from a thematic map...
This image (below) shows data in a "Pan Tree."
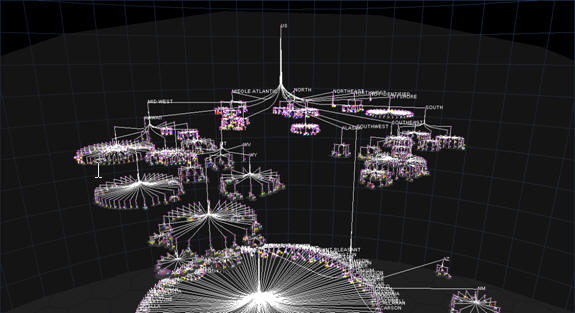 |
| This image might represent a data visualization of your hard drive, with each cluster being a folder or directory and the file that they contain.In my case, the top could represent my root directory (C:) and the bottom Pan would be either my temporary directory or more likely my email directory and all the old emails they contain. (Source: Battelle) Click image for larger view. |
Another view is the "Network View" (below).
 |
| Normally, a network view could just represent the lines of coincidence between nodes on the network. Starlight can represent the relationships of coincidence, thematize the nature of those relationships and show the sub-relationships as well. Remember that all the attributes are available just like in a mapping program.As this is 3D, you can rotate the object to look at the other side. (Source: Battelle) Click image for larger view. |
Yet another view is the "Link Array" (below).
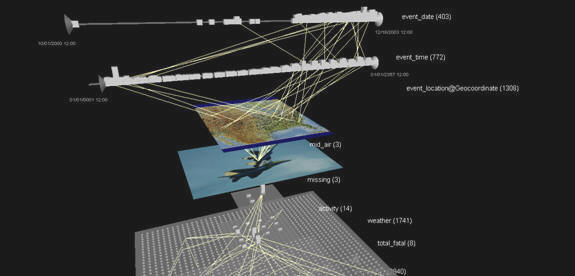 |
| The link array works similar to a prism map where the geography is pulled up the Z axis by a value.In this case (starting at the bottom), a data grid is pulled up by a value, tied to a data relationship with the image of the airplane, and then linked to two zoomed sections of a data grid prism map.Note that none of the data has to be from the same source, just related information. (Source: Battelle) Click image for larger view. |
Finally, one other view is a total view showing a set of data relationships from the previous image tied to a real geography.
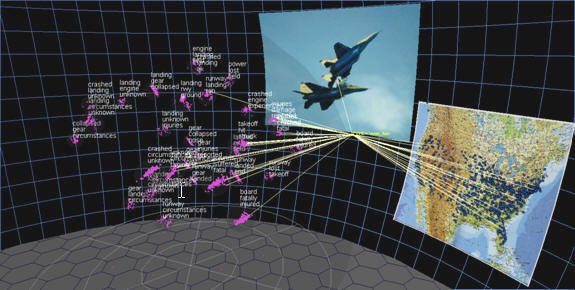 |
| This image shows aircraft accident incidents of various types and where they occurred.There are two key characteristics in this image.First, the image can have attributes not just super-imposed on it, but imbedded in it.Second, the data links can be real-time, allowing for the ability to see actions, relationships and other information dynamically update. (Source: Battelle) Click image for larger view. |
The required hardware is no different than a typical mapping or CAD workstation.Just the basics of a high-resolution video card, large hard drive and a reasonably fast processor.Starlight will also run on a server and is scalable relative to the needs and requirement of the user(s).
Software like this is not trivial to put in place, and requires a fairly high level of training to utilize at the level at which it was designed to operate.However, it appears that this technology could be used with typical corporate data sets (corporate sales or production data , for example), by a business geographer or a competitive intelligence professional.Battelle and the PNNL will sell the software outside the intelligence industry, but discourage a sale without installation and data source consulting, because they are concerned just acquiring the software will not result in a successful installation.
Starlight certainly expands the view of geography and perhaps offers an insight to skill sets that are in our future.Which is bringing together real, virtual and cyber geography into one 3- and 4-D workspace, performing better and more thorough analysis and ending up with far better results.
I had an opportunity to discuss Starlight with Brian Kritzstein, Principal Research Scientist, Information Visualization and Emerging Technologies, ITS Product line at Battelle Colonial Place Operations in Arlington, VA (part of The Battelle Memorial Institute).
First, a note about Battelle (from the Battelle Website):
Battelle serves industry and government in developing new technologies and products.We develop the technology behind the products of some of the most successful companies in the world.Our focus is on developing high-quality solutions and products and reducing time-to-market for our clients.
Battelle and the labs it manages and co-manages has a staff of 19,000 scientists, engineers, and support specialists.Each year, thousands of technology projects are in progress at Battelle's various business operations.These projects are performed for nearly 2,000 companies and government agencies.Battelle conducts $3 billion in annual research and development.Typically, this work results in between 50-100 patented inventions each year.Hal Reid (HR): Starlight appears as a combination of technologies directed toward data visualization. This product had to have some interesting core problems that it was originally trying to solve.What sort of a team was put together to create Starlight and solve those problems?
Brian Kritzstein (BK): The Starlight team responsible for the creation of the application all reside in Richland, WA, where PNNL is located.With the inclusion of some commercial off-the-shell (COTS) products, the R&D team at PNNL worked on a way to combine all of their own IP with the functionality of the COTS components to produce a first in class information visualization tool.Originally, the idea of Starlight was born in the form of a "challenge" presented to the lab in which they were asked to come up with a way to visualize the locations of things on a map.Once this started to gain traction, folks at the lab expanded on the idea of visualizing that limited type of information and included other elements of data ...times, dates, unstructured text, etc.All of these elements combined made up what many of the document types are within the community that has funded the research and development of the product.That was about six to eight years ago.
HR: With any software that is comprised of several existing technologies, when those technologies are selected they are weighed by functionality, ease of integration and the robustness of the technologies themselves.What were some of the factors that conditioned the selection choices for these technologies within Starlight?
BK: ESRI, used for the mapping, is well regarded within the GIS community.CCM, the database technology from ATS is fast and works with large sets of data quickly.The TRUST engine (Text Representation Using Subspace Transformation) from Boeing Phantom Works is one of the better lead system integrator-based clustering algorithms.Also, we had used THINGFINDER from INXIGHT, in one of the earlier versions of Starlight for entity extraction.
HR: Starlight is a complex product and while it was probably immediately understood by it's original target audience, this might not be the case for commercial users.Marketing has got to be a particular challenge.How do you market Starlight and make it salient to commercial users and what have you created as the unique selling points?
BK: We tend to "market" Starlight at government trade shows and conferences, since that is the typical audience.Word of mouth is one of the biggest forms of marketing we have been successful with.Many times, the phone will ring and it's someone I've never talked to before.They may have gotten a hold of the Starlight video CD and have formed a laundry list of questions.We try to convey to folks the benefit that visualizing data can have.While you may not find the needle in the haystack, we can at least point analysts in the right direction for further analysis of a particular item of interest.
From Our Homepage
Saying Farewell to an Amazing Journey
Communicating with Maps
Is There a GIS Career Ladder?
What does it mean to be geospatially smart? Series
Ways Real Estate and Property Developers Utilize Melissa GeoData for Data-Driven Decisions
Unlocking Value From Daily Satellite Imagery and Insights
Maximizing the Value of Your Address Data with Geo Addressing
How Indoor Mapping Enhances the Security of Smart Buildings
Look Ahead: AI, Location Intelligence and Efficiency
Collaboration Takes on Sea Level Rise & Dynamic Technology Environments
Brownies for Brownfields
Has Everything Been Mapped Already?
How Is Data Literacy Changing in an Artificial Intelligence Landscape
Portfolios for GIS Professionals: More Than Just Maps
How to Create a Distance Matrix in QGIS - A Step-by-Step Guide
7 Ideas for Bringing GIS into the K-12 Classroom
The Geography of Movement