When Cyclone Nargis hit the Southeast Asian country of
Myanmar in May 2008, governments and international relief agencies were
faced with a humanitarian emergency that required swift action. Because
of the size and complexity of the emergency, the United Nations
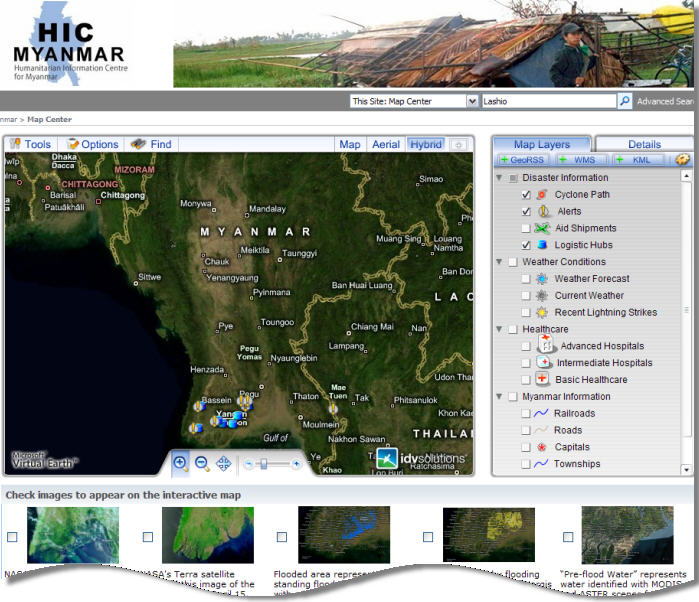
deployed a Humanitarian Information Center (HIC) website to coordinate
relief efforts. To effectively share information on weather, travel,
flooding and available health care resources the site included an
interactive Map Center, created in a single week using Visual Fusion by
IDV Solutions.
Visual Fusion provides a platform for managing many types of geospatial content and for creating applications that display enterprise data and Web feeds on a Virtual Earth map. For the Myanmar HIC, it solved the problem of uniting data in diverse formats from many sources, including:
The need for speed
The need to combine all these data sources was one primary requirement for the project; another was quick deployment. Relief agencies could not afford to wait for information that would allow them to deliver supplies and ensure the safety of their workers in Myanmar.
Using Visual Fusion's application building tools, the Myanmar map was ready to go within days. The software provides two paths to application building: users without DBA or GIS expertise can quickly build mash-ups, while IT professionals can build applications with extensive customization. For the Myanmar map, developers were able to provide all of the needed features using out-of-the-box functionality.
Integration with SharePoint
A factor in building the Myanmar application so rapidly was Visual Fusion's tight integration with Microsoft's SharePoint collaboration portal. Visual Fusion exploits the SharePoint infrastructure for site building, user authentication, search and content management. On top of these, IDV has layered custom Web parts and the ability to geo-enable SharePoint content.
Visual Fusion has two components:
Managing geospatial content
To promote collaboration among agencies, Myanmar map users could request access through an on-screen link to add information to the portal. Thus, the Myanmar data came from multiple sources in many formats, including image overlays, SharePoint lists, GeoRSS feeds, KML files and spreadsheets. Visual Fusion and SharePoint provided a convenient way to manage this diverse content and share it among many agencies.
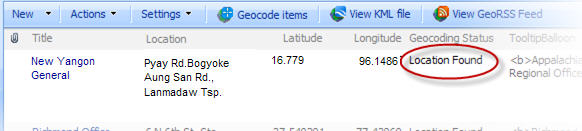
Visual Fusion Server supplies SharePoint templates for creating custom lists and libraries. These templates include Visual Fusion's geocoding function; for any item with a valid address but no latitude and longitude, VFS automatically retrieves the coordinates from Web services. Through MOSS Excel services, Visual Fusion extends this content management and geocoding functionality to data in Excel spreadsheets. Users can apply the VFS templates and geocoding retroactively to existing SharePoint lists and libraries.
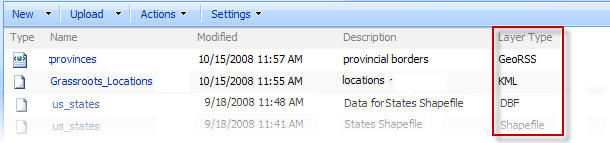
To share GeoRSS, KML and .shp files, users upload them into custom libraries built from the Visual Fusion templates. Custom lists house links to GeoRSS, KML or WMS Web feeds.
VFS can also connect to data sources outside SharePoint. Connectors are
available to access data through the Business Data Catalog, and to
connect to SQL Server, Oracle, ArcSDE and MapPoint databases.
Developers can write additional connectors using the Visual Fusion SDK.
Building applications rapidly
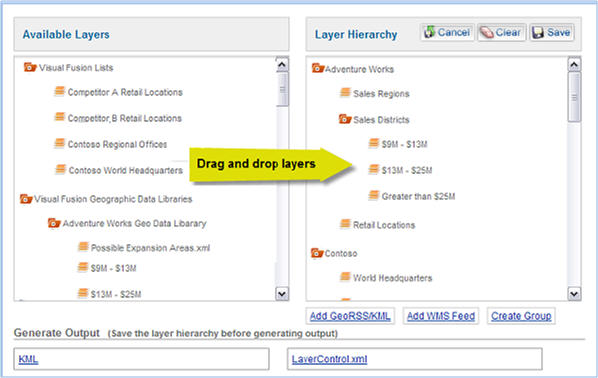
Visual Fusion applications like the Myanmar map are built in SharePoint sites, using custom Web parts. One of these, the Composer, is a drag-and-drop interface for adding data layers to an application and styling them. The Composer discovers and lists all the available data layers, in SharePoint and outside it. A user can drag these layers into a hierarchy, creating groups that expand and collapse, and selecting colors, icons, line styles and other visual attributes.
The user can also enter a URL directly into the Composer to create a layer for a GeoRSS or WMS feed. Using the Composer, the layer hierarchy for a new application can be composed from existing data sources in as little as 20 minutes.
Site administrators and similar users can customize applications
further by editing configuration files. Options that they can configure
include filters, data transformations and style rules.
While the Myanmar map was built entirely with out-of-the-box functionality, when an enterprise has additional needs, developers can use the SDK to write custom data connectors, request handlers, filters, style rules and geocoders.
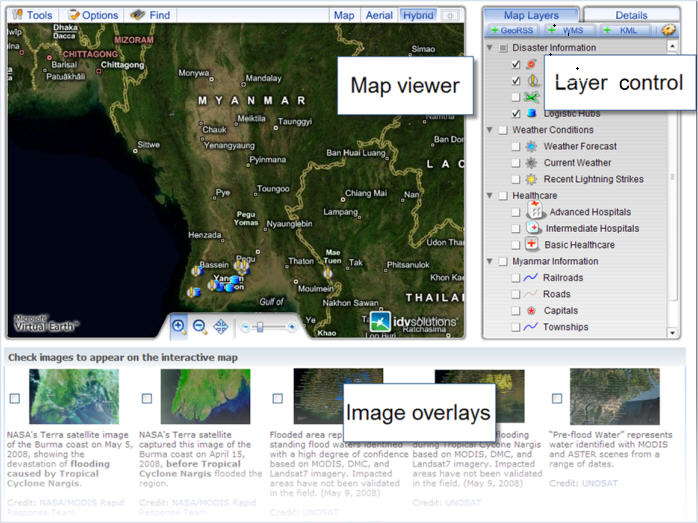
The RIA interface
The end user interface, Visual Fusion Experience, is a rich Internet application (RIA) composed of two Web parts, a map viewer and a layer control. Additional Web parts can be added to applications when required. The Myanmar map application incorporates a Web part that allows users to select image overlays to display on the map.
Map Viewer
The map viewer provides users with a set of tools that include:
The spatial query tool lets end users draw an area on the map and send all the data points within that area to a form or other Web part. Using the drawing tools, end users can annotate the map with points, lines and polygons, include metadata for each item, and then save this annotation in SharePoint.
The map viewer is configured through the SharePoint user interface and any of these tools can be disabled at any time through the Web part configuration.
Layer Control
End users turn map layers off and on using the layer control. Like the map viewer, this Web part includes a set of tools that are configurable through the SharePoint UI:
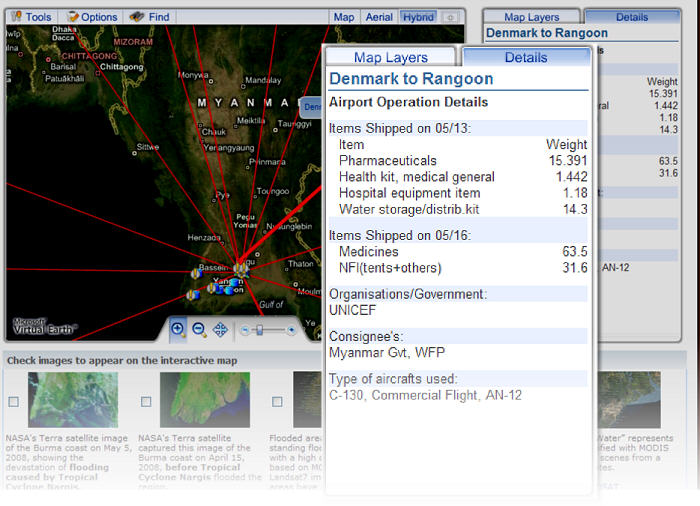
Extending the interface
Developers can extend this user interface further. Through the JavaScript API, the map viewer and layer control can be configured to communicate with third-party Web parts. For example, a developer can configure the interface so that clicking on a map item causes data or charts associated with the item to display in a third Web part. Or an application can be set up so that when the end user selects a map region with the spatial query tool, the map viewer launches a request and sends the query results to a data grid or form Web part.
Leveraging SharePoint Capabilities
In the Myanmar map, the underlying SharePoint infrastructure made it possible to create the new Visual Fusion application quickly while achieving the project's urgent goal: visualizing vital data in meaningful ways, so that users could make better informed decisions in less time.
Visual Fusion provides a platform for managing many types of geospatial content and for creating applications that display enterprise data and Web feeds on a Virtual Earth map. For the Myanmar HIC, it solved the problem of uniting data in diverse formats from many sources, including:
- NASA satellite images of Myanmar
- weather forecasts and rainfall data from commercial forecasting services
- information on the country's transportation network, from the United Nations Joint Logistics Centre (UNJLC)
- maps indicating flooded areas from the UN Operational Satellite Applications Programme
- locations of logistical hubs
- security alerts
- locations of hospitals and other health care providers
- information on incoming aid shipments
 |
The need to combine all these data sources was one primary requirement for the project; another was quick deployment. Relief agencies could not afford to wait for information that would allow them to deliver supplies and ensure the safety of their workers in Myanmar.
Using Visual Fusion's application building tools, the Myanmar map was ready to go within days. The software provides two paths to application building: users without DBA or GIS expertise can quickly build mash-ups, while IT professionals can build applications with extensive customization. For the Myanmar map, developers were able to provide all of the needed features using out-of-the-box functionality.
Integration with SharePoint
A factor in building the Myanmar application so rapidly was Visual Fusion's tight integration with Microsoft's SharePoint collaboration portal. Visual Fusion exploits the SharePoint infrastructure for site building, user authentication, search and content management. On top of these, IDV has layered custom Web parts and the ability to geo-enable SharePoint content.
Visual Fusion has two components:
- Visual Fusion Experience (VFX), the client component of Visual Fusion Suite, is a browser-based rich Internet application (RIA), implemented on a SharePoint site using Web parts. A JavaScript API allows developers to customize and extend this interface.
- Visual Fusion Server (VFS) is implemented as a set of SharePoint Features and packaged as a SharePoint Solution. It includes data connectors, a styling engine and tools for data filtering.
 |
Managing geospatial content
To promote collaboration among agencies, Myanmar map users could request access through an on-screen link to add information to the portal. Thus, the Myanmar data came from multiple sources in many formats, including image overlays, SharePoint lists, GeoRSS feeds, KML files and spreadsheets. Visual Fusion and SharePoint provided a convenient way to manage this diverse content and share it among many agencies.
Visual Fusion Server supplies SharePoint templates for creating custom lists and libraries. These templates include Visual Fusion's geocoding function; for any item with a valid address but no latitude and longitude, VFS automatically retrieves the coordinates from Web services. Through MOSS Excel services, Visual Fusion extends this content management and geocoding functionality to data in Excel spreadsheets. Users can apply the VFS templates and geocoding retroactively to existing SharePoint lists and libraries.
To share GeoRSS, KML and .shp files, users upload them into custom libraries built from the Visual Fusion templates. Custom lists house links to GeoRSS, KML or WMS Web feeds.
 |
Building applications rapidly
Visual Fusion applications like the Myanmar map are built in SharePoint sites, using custom Web parts. One of these, the Composer, is a drag-and-drop interface for adding data layers to an application and styling them. The Composer discovers and lists all the available data layers, in SharePoint and outside it. A user can drag these layers into a hierarchy, creating groups that expand and collapse, and selecting colors, icons, line styles and other visual attributes.
The user can also enter a URL directly into the Composer to create a layer for a GeoRSS or WMS feed. Using the Composer, the layer hierarchy for a new application can be composed from existing data sources in as little as 20 minutes.
 |
While the Myanmar map was built entirely with out-of-the-box functionality, when an enterprise has additional needs, developers can use the SDK to write custom data connectors, request handlers, filters, style rules and geocoders.
The RIA interface
The end user interface, Visual Fusion Experience, is a rich Internet application (RIA) composed of two Web parts, a map viewer and a layer control. Additional Web parts can be added to applications when required. The Myanmar map application incorporates a Web part that allows users to select image overlays to display on the map.
 |
Map Viewer
The map viewer provides users with a set of tools that include:
- pan and zoom
- location search
- time zone viewer
- distance measure
- latitude and longitude display for the cursor position
- inset map for overviews and close-ups
- timeline viewer
- spatial query tool
- drawing tools
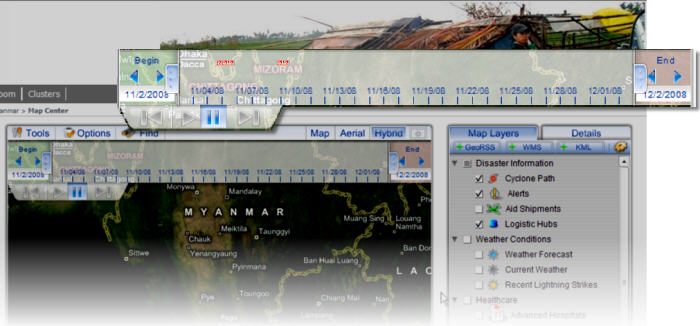 |
The spatial query tool lets end users draw an area on the map and send all the data points within that area to a form or other Web part. Using the drawing tools, end users can annotate the map with points, lines and polygons, include metadata for each item, and then save this annotation in SharePoint.
The map viewer is configured through the SharePoint user interface and any of these tools can be disabled at any time through the Web part configuration.
Layer Control
End users turn map layers off and on using the layer control. Like the map viewer, this Web part includes a set of tools that are configurable through the SharePoint UI:
- The Enterprise Search tool uses a custom search scope and displays search results as data points on the map.
- A configurable set of buttons lets the end user enter URLs directly into the layer control to display GeoRSS, KML or WMS feeds along with the existing data layers.
Extending the interface
Developers can extend this user interface further. Through the JavaScript API, the map viewer and layer control can be configured to communicate with third-party Web parts. For example, a developer can configure the interface so that clicking on a map item causes data or charts associated with the item to display in a third Web part. Or an application can be set up so that when the end user selects a map region with the spatial query tool, the map viewer launches a request and sends the query results to a data grid or form Web part.
 |
In the Myanmar map, the underlying SharePoint infrastructure made it possible to create the new Visual Fusion application quickly while achieving the project's urgent goal: visualizing vital data in meaningful ways, so that users could make better informed decisions in less time.
From Our Homepage
Saying Farewell to an Amazing Journey
Communicating with Maps
Is There a GIS Career Ladder?
What does it mean to be geospatially smart? Series
Ways Real Estate and Property Developers Utilize Melissa GeoData for Data-Driven Decisions
Unlocking Value From Daily Satellite Imagery and Insights
Maximizing the Value of Your Address Data with Geo Addressing
How Indoor Mapping Enhances the Security of Smart Buildings
Look Ahead: AI, Location Intelligence and Efficiency
Collaboration Takes on Sea Level Rise & Dynamic Technology Environments
Brownies for Brownfields
Has Everything Been Mapped Already?
How Is Data Literacy Changing in an Artificial Intelligence Landscape
Portfolios for GIS Professionals: More Than Just Maps
How to Create a Distance Matrix in QGIS - A Step-by-Step Guide
7 Ideas for Bringing GIS into the K-12 Classroom
The Geography of Movement