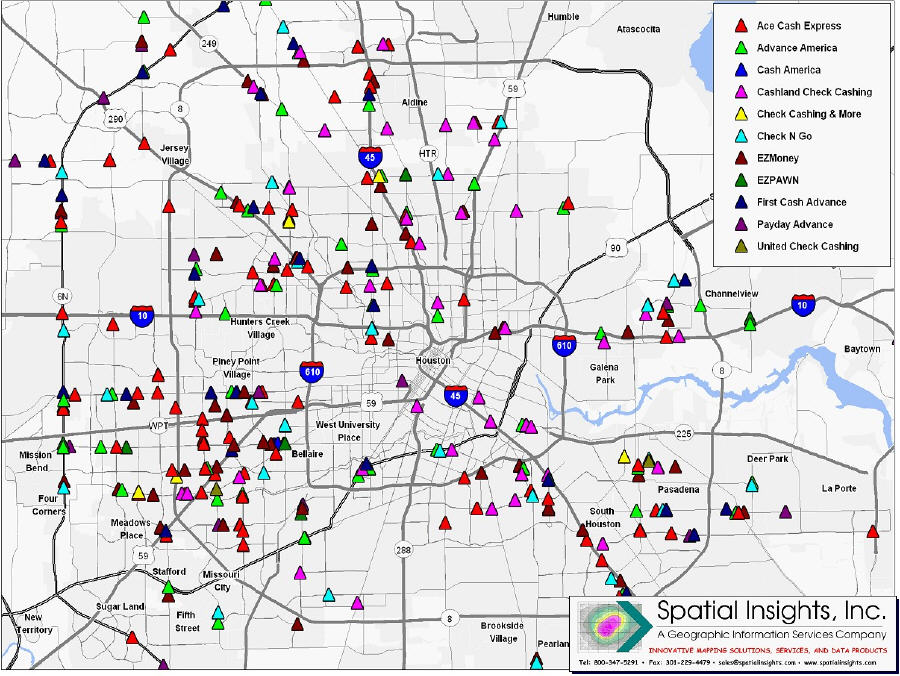
Spatial Insights undertook a market potential analysis
of check cashing and pawn shop expansion potential in the Houston, TX
metropolitan area. Using precision geocoded business locations from CAP
Locations ReCAP Retail database, coupled with current year
demographic estimates sourced from AGS,
we employed a suite of GIS tools to analyze and map the geographic
distribution of demographic demand and market potential.
The demographic analysis was performed using block group level demographics. Block groups are neighborhood-sized areas with similar demographic composition. They are the smallest units of geography for which most demographic data estimates are available.
In order to assess the potential demographic demand, we evaluated the current year (2008) demographic data by block group, as follows:
Index Mathematics
In this example, each variable was equally weighted and classified into five ranges, each containing 20% of the data. A weight was assigned to each range of data, according to its relative importance. In the above schema, the best possible demand score is 25, the worst possible demand score is 5, and a score of 25 represents areas that have:
Demand Index Score Results
TrendMap, a trend surface mapping tool developed by Spatial Insights, was used to generate a "hotspot" map of demand, based on the calculated demand index scores. The maps depict areas that have the highest demand index scores as magenta, with decreasing scores in shades of red, orange, yellow and blue.
Supply Side Analysis
CAP Locations ReCAP Retail database of existing check cashing and pawn shops were analyzed using TrendMap. The resulting map shows the concentration of competitors based on floor space (gross leasable area, or GLA) of the stores within a 2.0 mile radius. The map depicts areas that have the highest concentrations of square footage (GLA) as magenta, with decreasing competitor density in successively "cooler" shades of red, yellow, green and blue.
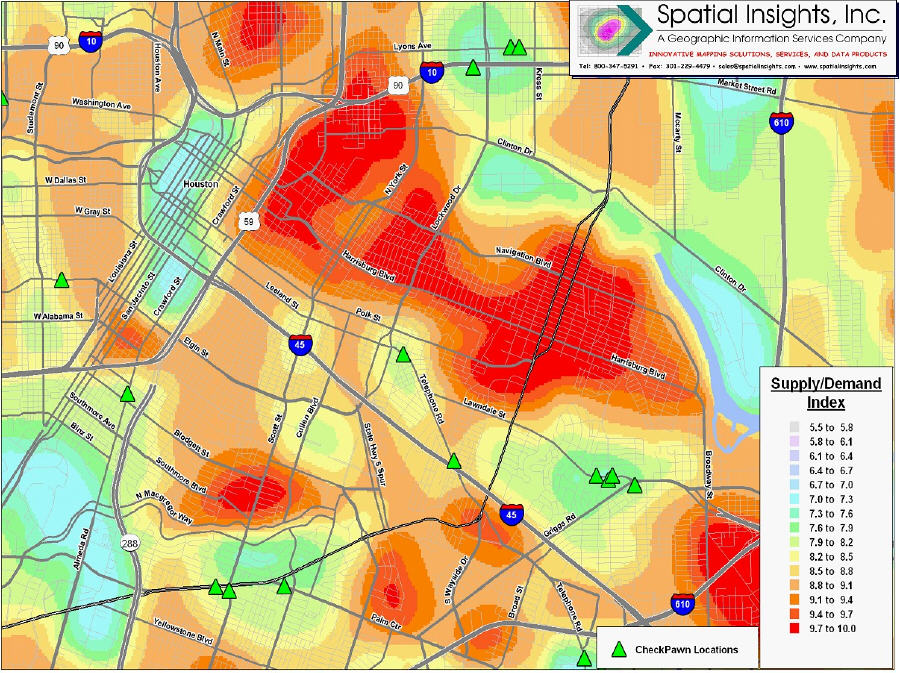
Supply/Demand Model
In order to identify areas of strong market potential, a supply/demand model was developed that delineates areas based on the level of modeled demographic demand, relative to the existing "supply" of retail space. A simple bivariate indexing scheme was employed that compares the index scores from the demographic demand model with the supply-side hot-spot map.
The mathematics of the schema used are as follows:
Conclusions
Understanding the geographic correspondence between areas of strong demographic demand and low concentrations of competitive retail space provides a basis for identifying potential expansion opportunities. More detailed study of specific areas is warranted for those areas that exhibit strong combinations of demographic demand and weak competitive factors.
 |
The demographic analysis was performed using block group level demographics. Block groups are neighborhood-sized areas with similar demographic composition. They are the smallest units of geography for which most demographic data estimates are available.
In order to assess the potential demographic demand, we evaluated the current year (2008) demographic data by block group, as follows:
- Total population
- Median household income
- Percentage of renter occupied dwelling units
- Average household size
- Population density
Index Mathematics
In this example, each variable was equally weighted and classified into five ranges, each containing 20% of the data. A weight was assigned to each range of data, according to its relative importance. In the above schema, the best possible demand score is 25, the worst possible demand score is 5, and a score of 25 represents areas that have:
- Population > 2,494
- Income < $32,767
- Over 303 renter occupied dwelling units
- Average household size > 3.36
- Population density > 6,333
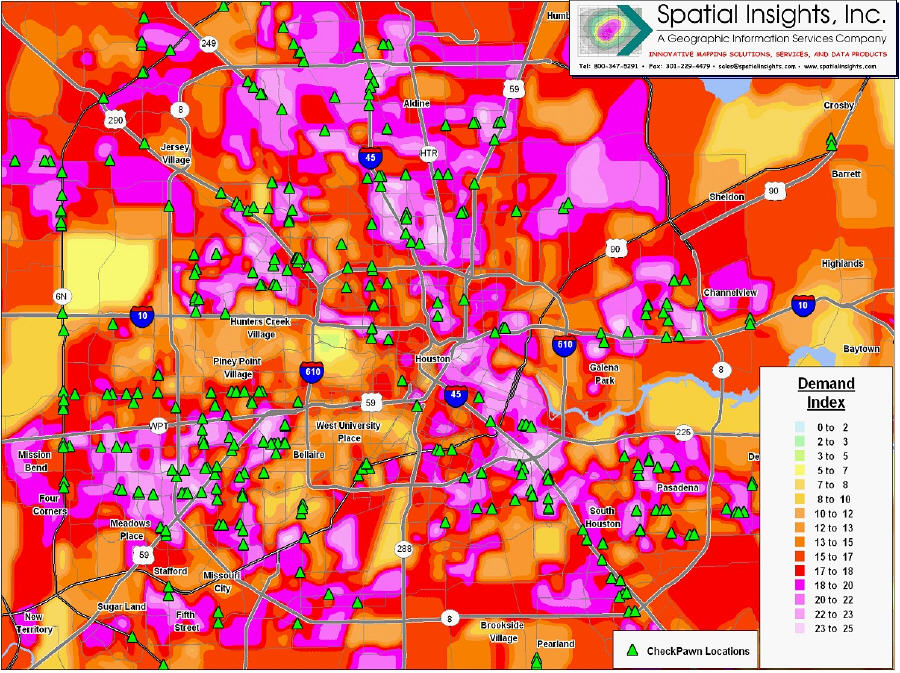
Demand Index Score Results
TrendMap, a trend surface mapping tool developed by Spatial Insights, was used to generate a "hotspot" map of demand, based on the calculated demand index scores. The maps depict areas that have the highest demand index scores as magenta, with decreasing scores in shades of red, orange, yellow and blue.
 |
 |
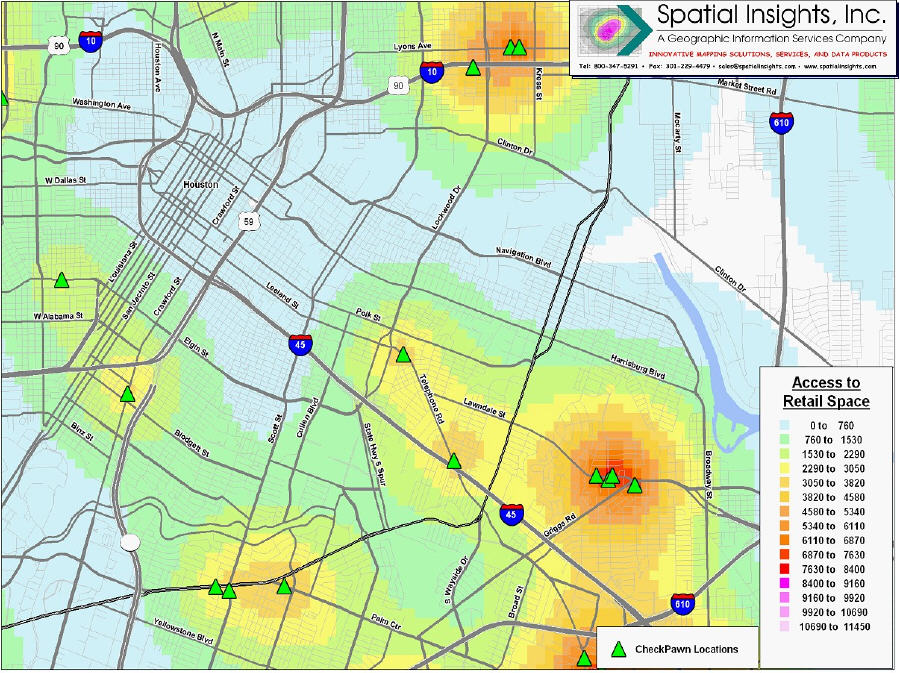
Supply Side Analysis
CAP Locations ReCAP Retail database of existing check cashing and pawn shops were analyzed using TrendMap. The resulting map shows the concentration of competitors based on floor space (gross leasable area, or GLA) of the stores within a 2.0 mile radius. The map depicts areas that have the highest concentrations of square footage (GLA) as magenta, with decreasing competitor density in successively "cooler" shades of red, yellow, green and blue.
 |
 |
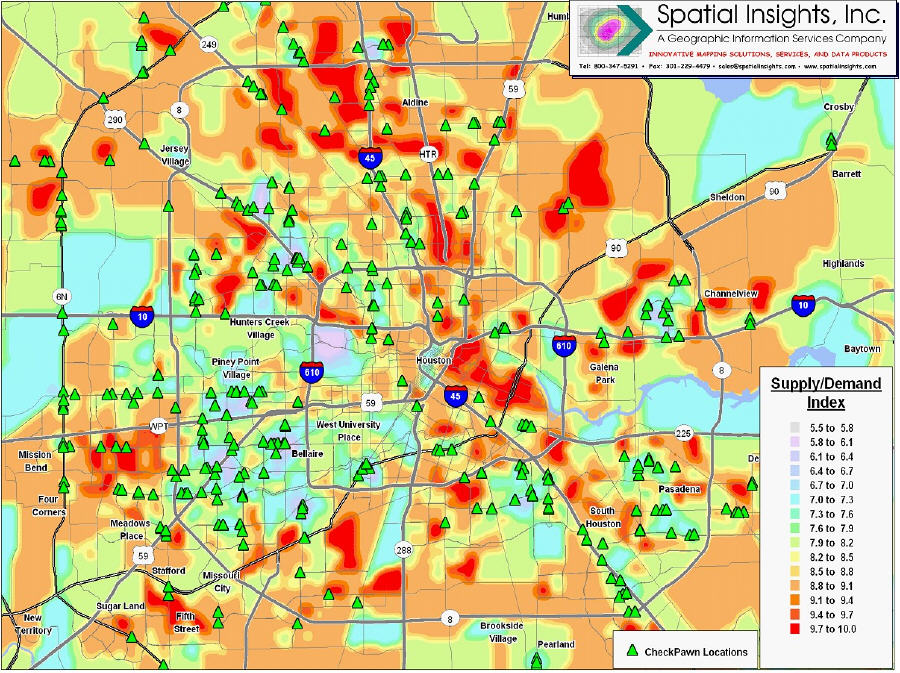
Supply/Demand Model
In order to identify areas of strong market potential, a supply/demand model was developed that delineates areas based on the level of modeled demographic demand, relative to the existing "supply" of retail space. A simple bivariate indexing scheme was employed that compares the index scores from the demographic demand model with the supply-side hot-spot map.
The mathematics of the schema used are as follows:
- A score of 10 (best case scenario) represents areas that have the strongest demographic demand, and the lowest existing retail space (GLA)
- Lower scores represent areas that have either less demand or more existing retail space
 |
 |
Understanding the geographic correspondence between areas of strong demographic demand and low concentrations of competitive retail space provides a basis for identifying potential expansion opportunities. More detailed study of specific areas is warranted for those areas that exhibit strong combinations of demographic demand and weak competitive factors.
From Our Homepage
Saying Farewell to an Amazing Journey
Communicating with Maps
Is There a GIS Career Ladder?
What does it mean to be geospatially smart? Series
Ways Real Estate and Property Developers Utilize Melissa GeoData for Data-Driven Decisions
Unlocking Value From Daily Satellite Imagery and Insights
Maximizing the Value of Your Address Data with Geo Addressing
How Indoor Mapping Enhances the Security of Smart Buildings
Look Ahead: AI, Location Intelligence and Efficiency
Collaboration Takes on Sea Level Rise & Dynamic Technology Environments
Brownies for Brownfields
Has Everything Been Mapped Already?
How Is Data Literacy Changing in an Artificial Intelligence Landscape
Portfolios for GIS Professionals: More Than Just Maps
How to Create a Distance Matrix in QGIS - A Step-by-Step Guide
7 Ideas for Bringing GIS into the K-12 Classroom
The Geography of Movement