 Lynn
Bodin Wombold: CommunityTM
TapestryTM represents
the fourth generation of market segmentation systems that began with ACORN.
In fact, the lead developers of the 1990-based ACORN also built Tapestry.
We combined the cumulative knowledge from past development with the application
of the latest research in data mining techniques to provide a robust successor
to ACORN.Yes, there are methodological differences.Our experience with
standard techniques of cluster analysis provided the clues to improve traditional
methods to introduce innovations to classical cluster analysis.
Lynn
Bodin Wombold: CommunityTM
TapestryTM represents
the fourth generation of market segmentation systems that began with ACORN.
In fact, the lead developers of the 1990-based ACORN also built Tapestry.
We combined the cumulative knowledge from past development with the application
of the latest research in data mining techniques to provide a robust successor
to ACORN.Yes, there are methodological differences.Our experience with
standard techniques of cluster analysis provided the clues to improve traditional
methods to introduce innovations to classical cluster analysis.
Cluster analysis actually refers to a family of techniques that are neither new nor unique to market segmentation.Simply, these techniques represent different ways to organize and sort data.The k-means technique was used to build Tapestry from geodemographic data.Given its ability to handle large volumes of data, this technique represents the most appropriate approach and has proven effective in a wide range of applications.
However, the k-means technique has two limitations that we addressed by modifying the calculations and adapting data mining techniques.First, the k-means technique is sensitive to extreme values or outliers.So we eschewed the conventional use of arithmetic means, which are sensitive to the effect of outliers, in favor of medians to assign neighborhoods to market segments.Additionally, we used a least absolute deviation measure in lieu of the usual measure of Euclidean distance. Euclidean distance can also be influenced easily by extreme values.One data item can distort the distance and unduly influence the segment assignment. The least absolute deviation is more robust and less susceptible to extreme data.
Second, the k-means technique is susceptible to the choice of starting points.You must start somewhere; there must be a set of initial points to represent the 65 market segments. It is customary to select the starting points randomly.Refinements to random selection have been developed, but we found none satisfactory.To adapt the selection of initial points to geodemographic data, we modified a data mining technique.The technique employs the concepts of averaging and sampling to produce representative initial points -- leading to a much more effective set of initial points for the k-means clustering.
We changed the methodology and expanded the source data for Tapestry.The result is a market segmentation system that is robust and reflective of the increasing diversity in American society.Yes, CACI UK still markets its segmentation system under the name ACORN.In the U.S., Tapestry succeeds ACORN.
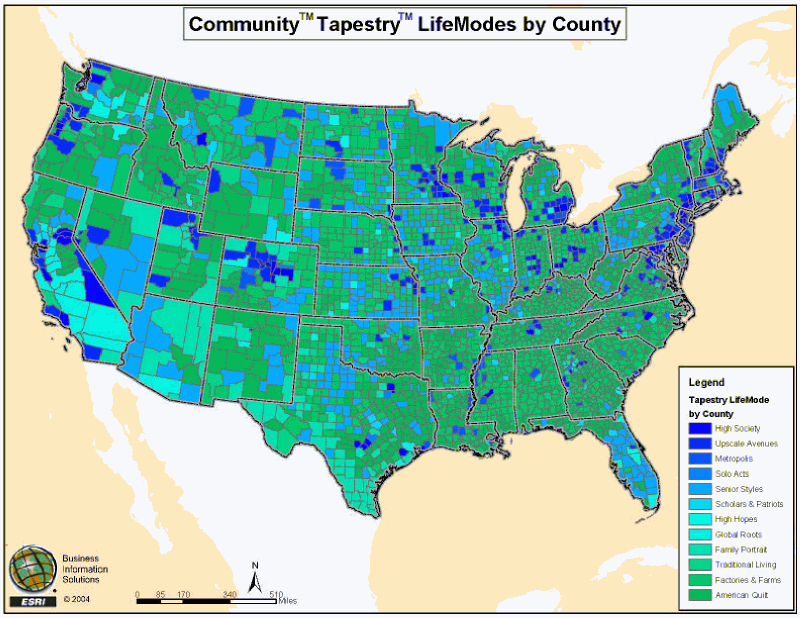
Click on image for larger
view.
Nora Parker: How might you compare and contrast Tapestry to some of its competitors? (e.g., Experian's MOSAIC, or Claritas' PRIZM, for example.)
LBW: Contrary to popular opinion, there are only two ways to compare different market segmentation systems.One way would be to review the variables selected to profile the market segments.The selection of variables is critical to successful profiles of consumer markets.The care invested in the development of cluster analysis techniques is nothing compared to the selection of variables -- principle components analysis, graphical techniques, and correlation matrices.However, this information is proprietary.Vendors provide profiles of their markets, but not the list of variables used to develop the market segments.
The second yardstick is available and more practical -- does the system work? Does it differentiate consumer behavior? Do the segments capture the diversity of the population and reflect it with homogeneous consumer markets?
Because I do not know what variables were used in the competitors' systems, I would review the profiles of the markets vis-à-vis Tapestry profiles.How wealthy are the most affluent markets? How old are the senior markets? How young are the Gen Y markets? Look to the purity or homogeneity of the individual markets and the distinction from other markets.The point of a market segmentation system is to discriminate consumer behavior. I know that Tapestry works.
Nora Parker: A year ago, when Community Tapestry's development was first announced, the press release touted that "The ESRI BIS team of demographers, statisticians, and data developers building the Community market segmentation system is led by three experts with more than 50 years of combined experience in the field." Can you tell us something about these individuals?
LBW: The analysts referenced in that press release include Edmond Ting, Larry Disney and me. Edmond has been working in the marketing information industry since 1987, joined ESRI Business Information Solutions (ESRI BIS) in 2003 as Manager of Data Development.His experience has been focused on the development of market segmentation systems, although Edmond's primary responsibilities at ESRI BIS also include demographic forecasts.Edmond and I also worked on the 1990 version of ACORN, and his experience includes work on PRIZM.
Larry is Director of Analytical Services at ESRI BIS.His expertise includes custom modeling, creating sophisticated general and industry specific segmentation systems and development of neighborhood segmentation systems.Larry's experience also includes work on PRIZM.I have 30+ years of experience as an applied demographer. The principal development team also includes Douglas Skuta, Polly Barbee and Sangita Vashi -- with a combined experience closer to 100 years.Supporting and promoting our work is a cast of dozens at ESRI BIS and ESRI.
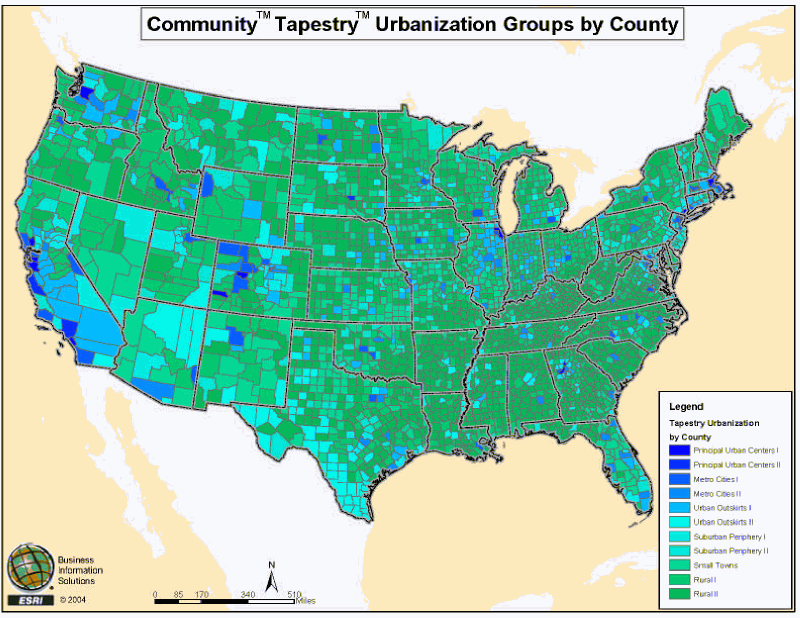
Click on image for larger
view.
Nora Parker: To date, what industry segments are the most prominently represented in the Community Tapestry user base?
LBW: ESRI BIS has a diverse user base that represents decision makers in several industries including retail, real estate, services, financial services, insurance, direct marketing, newspapers, cable television, utilities, and nonprofit organizations.Segmentation products have a wide appeal, and we provide Tapestry data to all industries.
Nora Parker: What can you tell us about your 2004/2009 updates that are now in progress? Can we expect major changes in terms of new demographic trends to be revealed with this update?
LBW: The 2004/2009 updates are completed.The numbers reflect continuing adjustments in the economy and reveal some interesting changes in demographic trends: The effects of the recent recession on business have diminished.Recovery has restored real GDR growth to over four percent (fourth quarter 2003).Inflation is increasing slowly, up 2.3 percent in 2003.Interest rates remain at historic lows, and personal consumption expenditures are up 4.3 percent from a year ago.However, the effects of the recession linger in the labor force.
Employment growth is erratic. Job loss continues in industries like manufacturing, agriculture and now information services, but rapid growth characterizes health care services, real estate and administrative/support services.The net effect is a small increase in employment, less than one percent, and an increase in the number of unemployed, now over ten million.The jobless recovery persists while businesses rely on increased worker productivity, outsourcing and cheaper labor abroad.
Household income increased by over three percent in the past year -- a slight (0.1 percentage point) improvement over the previous year.Again, the change is inconsistent with growth of 4.5 percent among the highest income households compared to only 3.2 percent among the lower income households.
Despite the sluggish growth in household income, the housing market remains robust.Low interest rates, innovative financing programs and government incentive and assistance programs have pushed up median home value from $112,000 in 2000 to almost $146,000 in 2004 and boosted the home ownership rate to over 67 percent in 2004. This fast pace of growth in home ownership is unlikely to continue for the remainder of the decade.While the number of homeowners will continue to grow, the rate of home ownership will not increase like it has since 2000.
The next wave of new homeowners will be Gen Y, who is just now maturing into household formation years. This generation rivals the Baby Boomers in size, but not composition.Gen Y includes not only the children of Baby Boomers, but also waves of recent immigrants to the U.S.It is more diverse than the Baby Boom -- and not as predictable.
Demographically, the effects of the echo boom are evident in the age distribution of the population, too.The increase in the median age, which has followed the aging of the Baby Boom cohorts for years, has either slowed or reversed in most areas. Although some states boast a median age of over 40 years, many areas are now experiencing a distinct "younging" of the population.This trend is likely to continue.As the echo effect of the Baby Boom wanes, births are still increasing in the U.S.with younger families arriving and, soon enough, with family formation by Gen Y.
Other changes introduced with the 2004/2009 forecasts include geographic updates:
- In Colorado, parts of Adams, Boulder, Jefferson, and Weld County split to become new Broomfield County; in Virginia, Clifton Forge City merged with Alleghany County.Based upon the changes in Colorado and Virginia, all databases are restructured from the block level up, and all data for 1990 and 2000 are revised for the affected areas.
- With the 2004/2009 update release, we provide data for the latest metropolitan and micropolitan statistical areas released by the Office of Management and Budget in February 2004.