A few years ago Autodesk decided that sharing
information about new products with the press at Autodesk University,
typically held in late November, and then waiting until spring to
release those products wasn't working out. So, last year, the company
launched a new event, Autodesk World Press Day, held in February, to
give journalists insight into the company's thinking, a look at new
products and to give the company a chance to hear from customers. (Last
year's coverage
appeared in All Points Blog.) The second iteration was held in San
Francisco just before Valentine's Day.
Here's what I took away from the two days.
More of the Same
This title is not meant to be negative; in fact, I think it will please many users to know that the path they've seen Autodesk follow recently is a good indicator for what's ahead. New product announcements (noted in press releases for AutoCAD and geospatial products) reveal what I consider to be enhancements, not revolutionary interface or format changes. I suspect few will rush out shouting, "I must have it now!" but neither will users fear the updates.
Familiar Trends
President and CEO Carl Bass ran down the key trends driving not only Autodesk, but much of the world's economy. There were no real surprises:
Autodesk Still Means Design
As much as Autodesk dabbles in other areas (geospatial, location-based services, product life cycle management…) its stock in trade is design. That was driven home by the four customer presentations in the opening plenary session. They included Ford Motor Company, on its use of technology for car design; General Motors, on its use of building modeling in designing its plants; Parsons Brinkerhoff and its partner, Caltrans, on their use of 3D modeling for planning, communicating and executing activities related to reinforcing the Bay Bridge in San Francisco; and Sony's ImageWorks, on its use of Autodesk's motion picture animation tools for blockbusters like "SpiderMan" and "The Polar Express." The most memorable bit for me was from Sony: the introductory film for a new 2000-foot high residence called the Chicago Spire.
Disruptive Technology and Democratization
These two "d" words popped up quite a lot in the vision discussions. Autodesk’s introduction of AutoCAD in 1982 was disruptive. That product was also democratizing in that it was available, as a commodity eventually, to all. The company continues to disrupt and democratize, even as it steps solidly into what CTO Jeff Kawalski called the company's third phase. The first, he noted, was AutoCAD, which allowed basic design. The second was the move to 3D and the creation of design models. The third phase, begun in 2005, focuses on complete models, those that allow viewers to "experience something before it's real."
Utilities
Geospatial took center stage in the context of utilities. The utility industry manager, Alan Saunders, followed a well-established path noting how changes in infrastructure (deteriorating to the point of falling down) and the workforce (getting old and retiring) demand solutions built into software. He also noted the importance of the right tools for design (CAD vs. GIS). We learned that Southern California Edison acquired 1,000 seats of Utility Design to help put the knowledge of retiring workers into the software, for future use. We learned that Arizona Public Service moved to Autodesk solutions from a GIS-based one, in part because designers would not give up AutoCAD.
Back to Las Vegas Water
Autodesk invited long-time customer Jonathan Pickus, manager, AM/FM/GIS Division, Las Vegas Valley Water District (LVVWD), to describe that organization's implementation. LVVWD is a key, celebrated user - I visited the site at one Autodesk University. The implementation solved severe backlogs in requests for service, united CAD, GIS and surveying, and can keep up with the growth (now slower with the mortgage crisis) in that city. The big takeaways from Pickus' discussion, however, seemed to have more to do with management/process than technology. Among them:
Hottest Demonstration
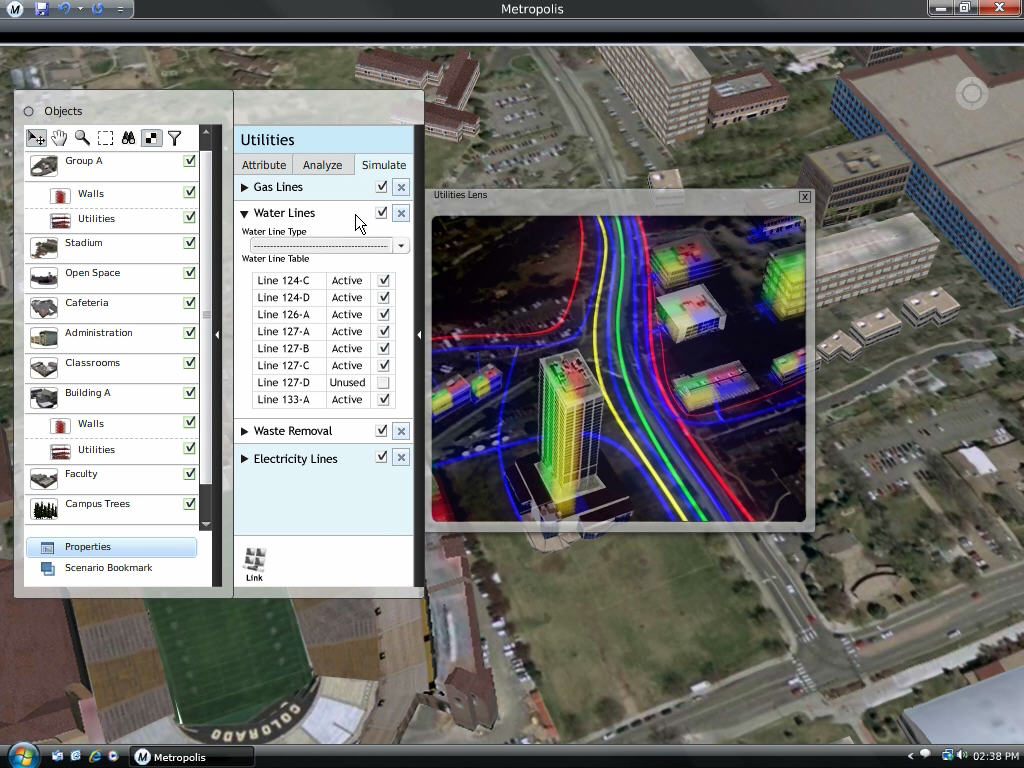
The hottest technology demo, a technology code-named Metropolis, which is being developed in Autodesk Labs, came at the very end of the geospatial presentation. The formal demo in the session opened with an aerial image of a college campus. As a "roamer window," called the "Utility Lens," passed over different parts of the image, underground and in-building information came to life. Different colored lines revealed underground water and gas lines. Different colors in the buildings themselves revealed usage of those utilities. That was cool, but it got better! Right inside Metropolis, the presenter turned off the water in one area (the blue line turned to white), added a new water line to an unserved building, and "turned the water back on." The new lines glowed blue to show that water was now flowing in the simulation. This combination of models, imagery, simulation, visualization and potential analysis caught everyone off guard.
Brian Mathews, an Autodesk Labs vice president, provided a broader overview of the technology. Metropolis is a fusion solution - tying together building information management (BIM), geospatial, manufacturing and other data to provide a visualization environment. But it's also about modeling and simulation. I watched as data from the Friends of the Urban Forest powered an Autodesk-written algorithm to "grow the trees." Then we looked at sun and shadow on 3D buildings on a particular day of the year. The shadows waxed and waned from sunrise to sunset. And, Metropolis can handle geospatial queries. We did a query to find all the elm trees, just in case Dutch elm disease hit the area. Yellow cones shot into space to highlight the unfortunate trees. We talked about using such a system to model noise in 3D and I pondered how real-time sensor data might be a valuable data source. This is one to watch as it hopefully graduates from the Labs soon and develops into a product. One caveat from Mathews: it's still tough to find large complete 3D models to explore in the system. I'm hopeful as technologies like this appear, there'll be more energy devoted to these data creation efforts.
More from the Lab
There's a lot going on in the Labs. Here are a few other highlights.
Webcam for geolocation. A very new project uses an inexpensive Webcam to decode tags it sees as indicators of location. In the laptop-based demo I saw, when the clip-on camera "saw" the tag, the app using it as a sensor panned to visualize the location coded in the tag. Basically, it's a "quick and dirty" way to let the computer know its indoor position, so that it can provide location-based information. The demo we were looking at involved underground utilities, but it could be anything.
Multitouch. Touch is "hot." Metropolis at this point has some basic touch controls, but another app better showed touch potential. I was taught to manipulate a 3D visualization of some sort of valve on the Multitouch Wall. (Here's CEO Carl Bass doing the same thing.) When I "clicked and dragged" with my finger, I expected the part to pan away from me. It didn't. A quick change to the UI changed what different touches would do. Now it behaved as I expected. Next I learned to use two fingers, then three, and eventually all ten. I'm slowly learning that you can convey quite a lot with several touches and that they do, indeed, save mouse clicks and perhaps the need for complex training. That said, I had a tough time after my 30 seconds of training getting just the right amount of pressure to operate the screen.
Software as a service (SaaS). Autodesk's project Freewheel allows manipulation of 2D and 3D DWF files directly in the browser (no plug-in). One advantage of note: security. The data are never sent to the end user's machine, instead just the "image" is sent.
Adapx Pen. I guess every vendor has to have its own demo and implementation. I was hustled through Autodesk's implementation after I said I'd seen it in use with other vendors’ technology. (The Adapx pen is a Bluetooth pen that writes on special paper such that the pen stores the location of everything it writes [1, 2].) That information can be transferred back "onto" the electronic version of the printed document. Autodesk has a deal with HP so that its implementation can print out the required "special paper" that allows the pen to capture the location of content created with it. Autodesk's Design Review is smart enough to interpret the scribbles into "real" redlines - with arrows, clouds, etc. It' even possible with a Bluetooth GPS to note a photo location on paper, take the photo (compete with geotag) and have Design Review input a "hotlink" to it.
[Disclosure: Autodesk paid for travel, food and lodging for this event. Corporate gifts were declined in lieu of a donation to charity.]
Here's what I took away from the two days.
More of the Same
This title is not meant to be negative; in fact, I think it will please many users to know that the path they've seen Autodesk follow recently is a good indicator for what's ahead. New product announcements (noted in press releases for AutoCAD and geospatial products) reveal what I consider to be enhancements, not revolutionary interface or format changes. I suspect few will rush out shouting, "I must have it now!" but neither will users fear the updates.
Familiar Trends
President and CEO Carl Bass ran down the key trends driving not only Autodesk, but much of the world's economy. There were no real surprises:
- the move from analog to digital (which in turn leads to multi-tasking, among other things)
- globalization means access to global talent (and eventually commoditization since borders can't protect products or services)
- an infrastructure boom (from the demands of 1 and 2)
- climate change and the cost of energy (connected to 3)
Autodesk Still Means Design
As much as Autodesk dabbles in other areas (geospatial, location-based services, product life cycle management…) its stock in trade is design. That was driven home by the four customer presentations in the opening plenary session. They included Ford Motor Company, on its use of technology for car design; General Motors, on its use of building modeling in designing its plants; Parsons Brinkerhoff and its partner, Caltrans, on their use of 3D modeling for planning, communicating and executing activities related to reinforcing the Bay Bridge in San Francisco; and Sony's ImageWorks, on its use of Autodesk's motion picture animation tools for blockbusters like "SpiderMan" and "The Polar Express." The most memorable bit for me was from Sony: the introductory film for a new 2000-foot high residence called the Chicago Spire.
Disruptive Technology and Democratization
These two "d" words popped up quite a lot in the vision discussions. Autodesk’s introduction of AutoCAD in 1982 was disruptive. That product was also democratizing in that it was available, as a commodity eventually, to all. The company continues to disrupt and democratize, even as it steps solidly into what CTO Jeff Kawalski called the company's third phase. The first, he noted, was AutoCAD, which allowed basic design. The second was the move to 3D and the creation of design models. The third phase, begun in 2005, focuses on complete models, those that allow viewers to "experience something before it's real."
Utilities
Geospatial took center stage in the context of utilities. The utility industry manager, Alan Saunders, followed a well-established path noting how changes in infrastructure (deteriorating to the point of falling down) and the workforce (getting old and retiring) demand solutions built into software. He also noted the importance of the right tools for design (CAD vs. GIS). We learned that Southern California Edison acquired 1,000 seats of Utility Design to help put the knowledge of retiring workers into the software, for future use. We learned that Arizona Public Service moved to Autodesk solutions from a GIS-based one, in part because designers would not give up AutoCAD.
Back to Las Vegas Water
Autodesk invited long-time customer Jonathan Pickus, manager, AM/FM/GIS Division, Las Vegas Valley Water District (LVVWD), to describe that organization's implementation. LVVWD is a key, celebrated user - I visited the site at one Autodesk University. The implementation solved severe backlogs in requests for service, united CAD, GIS and surveying, and can keep up with the growth (now slower with the mortgage crisis) in that city. The big takeaways from Pickus' discussion, however, seemed to have more to do with management/process than technology. Among them:
- At LVVWD, CAD/GIS and surveying are all managed together. At other utility companies, they are typically in different business units, leading to "turf wars."
- LVVWD implemented a Topobase/ArcSDE data solution ensuring that changes to one are immediately updated in the other. AutoCAD Map and ArcMap are the two main software clients.
- New data capture (from surveyors) is entered only once, not redrafted back at the office.
- A Web portal (MapGuide) supports 600 staff within the organization.
- Discussion of the "latest" project, which involves 3D models of LVVW assets, focuses on the best way to leverage this data for end-users.
Hottest Demonstration
The hottest technology demo, a technology code-named Metropolis, which is being developed in Autodesk Labs, came at the very end of the geospatial presentation. The formal demo in the session opened with an aerial image of a college campus. As a "roamer window," called the "Utility Lens," passed over different parts of the image, underground and in-building information came to life. Different colored lines revealed underground water and gas lines. Different colors in the buildings themselves revealed usage of those utilities. That was cool, but it got better! Right inside Metropolis, the presenter turned off the water in one area (the blue line turned to white), added a new water line to an unserved building, and "turned the water back on." The new lines glowed blue to show that water was now flowing in the simulation. This combination of models, imagery, simulation, visualization and potential analysis caught everyone off guard.
 |
Brian Mathews, an Autodesk Labs vice president, provided a broader overview of the technology. Metropolis is a fusion solution - tying together building information management (BIM), geospatial, manufacturing and other data to provide a visualization environment. But it's also about modeling and simulation. I watched as data from the Friends of the Urban Forest powered an Autodesk-written algorithm to "grow the trees." Then we looked at sun and shadow on 3D buildings on a particular day of the year. The shadows waxed and waned from sunrise to sunset. And, Metropolis can handle geospatial queries. We did a query to find all the elm trees, just in case Dutch elm disease hit the area. Yellow cones shot into space to highlight the unfortunate trees. We talked about using such a system to model noise in 3D and I pondered how real-time sensor data might be a valuable data source. This is one to watch as it hopefully graduates from the Labs soon and develops into a product. One caveat from Mathews: it's still tough to find large complete 3D models to explore in the system. I'm hopeful as technologies like this appear, there'll be more energy devoted to these data creation efforts.
More from the Lab
There's a lot going on in the Labs. Here are a few other highlights.
Webcam for geolocation. A very new project uses an inexpensive Webcam to decode tags it sees as indicators of location. In the laptop-based demo I saw, when the clip-on camera "saw" the tag, the app using it as a sensor panned to visualize the location coded in the tag. Basically, it's a "quick and dirty" way to let the computer know its indoor position, so that it can provide location-based information. The demo we were looking at involved underground utilities, but it could be anything.
Multitouch. Touch is "hot." Metropolis at this point has some basic touch controls, but another app better showed touch potential. I was taught to manipulate a 3D visualization of some sort of valve on the Multitouch Wall. (Here's CEO Carl Bass doing the same thing.) When I "clicked and dragged" with my finger, I expected the part to pan away from me. It didn't. A quick change to the UI changed what different touches would do. Now it behaved as I expected. Next I learned to use two fingers, then three, and eventually all ten. I'm slowly learning that you can convey quite a lot with several touches and that they do, indeed, save mouse clicks and perhaps the need for complex training. That said, I had a tough time after my 30 seconds of training getting just the right amount of pressure to operate the screen.
Software as a service (SaaS). Autodesk's project Freewheel allows manipulation of 2D and 3D DWF files directly in the browser (no plug-in). One advantage of note: security. The data are never sent to the end user's machine, instead just the "image" is sent.
Adapx Pen. I guess every vendor has to have its own demo and implementation. I was hustled through Autodesk's implementation after I said I'd seen it in use with other vendors’ technology. (The Adapx pen is a Bluetooth pen that writes on special paper such that the pen stores the location of everything it writes [1, 2].) That information can be transferred back "onto" the electronic version of the printed document. Autodesk has a deal with HP so that its implementation can print out the required "special paper" that allows the pen to capture the location of content created with it. Autodesk's Design Review is smart enough to interpret the scribbles into "real" redlines - with arrows, clouds, etc. It' even possible with a Bluetooth GPS to note a photo location on paper, take the photo (compete with geotag) and have Design Review input a "hotlink" to it.
[Disclosure: Autodesk paid for travel, food and lodging for this event. Corporate gifts were declined in lieu of a donation to charity.]
From Our Homepage
Saying Farewell to an Amazing Journey
Communicating with Maps
Is There a GIS Career Ladder?
What does it mean to be geospatially smart? Series
Ways Real Estate and Property Developers Utilize Melissa GeoData for Data-Driven Decisions
Unlocking Value From Daily Satellite Imagery and Insights
Maximizing the Value of Your Address Data with Geo Addressing
How Indoor Mapping Enhances the Security of Smart Buildings
Look Ahead: AI, Location Intelligence and Efficiency
Collaboration Takes on Sea Level Rise & Dynamic Technology Environments
Brownies for Brownfields
Has Everything Been Mapped Already?
How Is Data Literacy Changing in an Artificial Intelligence Landscape
Portfolios for GIS Professionals: More Than Just Maps
How to Create a Distance Matrix in QGIS - A Step-by-Step Guide
7 Ideas for Bringing GIS into the K-12 Classroom
The Geography of Movement