It has been said that happiness is
the difference between reality and expectations.
In business, expectations are often expressed in terms of return on investment, and in retail real estate, the key element of ROI is the top line sales volume of a store.The ability to
 accurately estimate
the sales volume of a proposed store
is critical to the survival and growth of a retail company because
closing a store is costly, and the drag on earnings immediately
translates into a hit to the value of the company's stock.
accurately estimate
the sales volume of a proposed store
is critical to the survival and growth of a retail company because
closing a store is costly, and the drag on earnings immediately
translates into a hit to the value of the company's stock.So, it can be said that happiness is a reliable sales forecasting process.
Sales forecasting is risk management.You have to be very careful to avoid dog stores (Ed Note; Dog = a store that is considerably below acceptable volumes).Sometimes you also have to step up and pay top dollar for a location that will deliver a premium return.However, the core of your portfolio will consist of solid performing locations that meet the ROI target established by the leadership of the company.In each case, there is a target sales volume that will produce the desired result.The more reliable the sales estimate, the less risk of disappointment and financial pain.
Overview of Sales Forecasting Model Accuracy
The accuracy and reliability of predictive models are usually evaluated on the basis of a comparison of predicted to actual volumes for existing units.The most useful yardstick is Mean Absolute Percent Error (MAPE) for the sample (i.e. "+/- x %").A reasonable target MAPE for a fully automated system is 15-20% for a spatial regression model.However, it is possible to achieve more accurate estimates when automated tools are combined with analyst judgment and supplemental primary research (+/- 10% is not unheard of, though few companies actually measure it often and precisely).
The reason that it is difficult to achieve a MAPE below 10% in a fully automated system is the fact that all factors in the market cannot be accurately identified, measured, and modeled, especially due to the non-linear nature of some variables.Adding variables to the model without a solid foundation in theory and common sense may improve the calculated MAPE, but the resulting model may be misleading and ultimately fail to improve the reliability of estimates for future stores.
The primary factors that affect sales performance of a store are as follows:
1.Trade Area Demand (demographics and daytime population)
2.Site Characteristics
3.Competition and Sister Stores
4.Management Quality
5.Regional Differences
6.Advertising and Promotion
7.Weather and other environmental effects
The accuracy of a sales forecasting model is a question of how well these variables can be specified and measured.The first three can generally be measured fairly well with good geographic analysis tools and experienced modelers.Regional differences can also be estimated if there are good theories as to the reasons for the variation (using statistics alone for this may lead to unfounded "overfitting" of a model).The other factors are very hard to specify and measure objectively, and lead to unexplained variance, or "error" in the models.From a GIS and statistics standpoint, skilled modelers using best practices will usually develop similar models.Some retail or restaurant concepts will have models that are more accurate than others because of the nature of their business, availability of customer data, and consistency of execution.But at the end of the day, a statistical model will be as good as it can be, and the cleverest modelers in the world won't be able to improve it.
Therefore, it is important to consider the manner in which models are used in the decision making process of the company.Here are some "business process" factors that determine the success that a company will have in using predictive models to guide site selection and market planning:
| 1.
|
Customer participation in the development of the model to ensure good business theory in variable selection and understanding of its strengths and weaknesses. |
| 2.
|
Training of decision makers (including senior management) on the interpretation of the output, use of confidence intervals for risk management, and how much weight to assign to the predictions in the overall decision. |
| 3.
|
Guidelines for obtaining additional information from primary research to supplement the model output and validate results. |
| 4.
|
Process for comparing predicted to actual results over time and analysis of differences to find ways to improve the model. |
| 5.
|
Train analysts and
decision makers in the use of analogs to interactively understand
potential opportunities and perils that may not be captured in a
statistical model. |
Using Predictive Models for Risk Management
In addition to the use of MAPE to measure accuracy, geoVue utilizes a risk management analysis based on a decision outcome matrix.The model is first used to predict the sales for each store in the sample.Next, the sales threshold required to approve a store and consider it successful is defined. Given this threshold, it is possible to form several confidence intervals around the sales forecasts.If the lower bound of the confidence interval is greater than the threshold, then the store is opened.Based on this rationale, the outcome of any decision can be described in terms of the following decision outcome matrix:
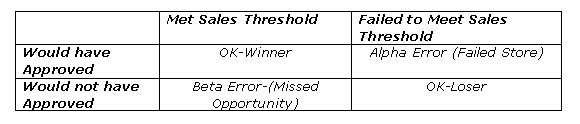 |
After a model is built, it is used to estimate the sales of the existing stores (either stabilized or first year volume).The model's estimate is compared to the both the sales forecast that was used to approve the deal and the actual volume for the forecast period.It is classified in one of four outcomes:
| 1.
|
Correctly picked a winner: Model estimate was at or above approved forecast and actual is at or above forecast. |
| 2.
|
Correctly picked a loser: Model estimate was below approved forecast (deal would have been killed) and actual is below approved forecast. |
| 3.
|
Alpha error (both model and approved forecast overestimated outcome): Model estimate was at or above approved forecast and actual was below approved forecast. |
| 4.
|
Beta error (model underestimated outcome and deal would not have been approved, but would have worked): Model estimate was below approved forecast and actual was above approved forecast. |
During the calibration phase of model development, the threshold for deal approval can be tailored to fit the risk profile of the decision makers.For example, if alpha error must be avoided at all costs, the threshold for approval can be raised so that the sample of existing stores would never have produced a failure.If some risk of failure is acceptable in order to promote growth of new stores, the threshold can be lowered to allow some alpha error while reducing the number of deals that would have been killed but worked.
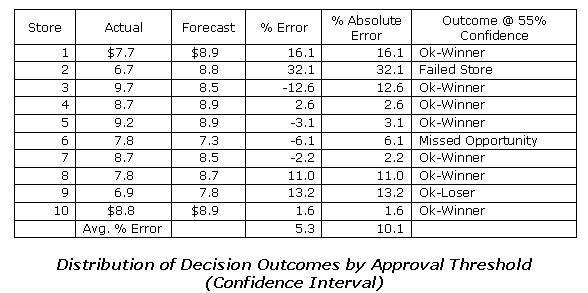
An example of the tables used for this process is shown below.The first table shows the calculated outcomes based on a success threshold of $7.4 Million and a confidence interval of 55% percent.The bar chart shows how the outcomes vary depending on the selection of the confidence interval.
 |
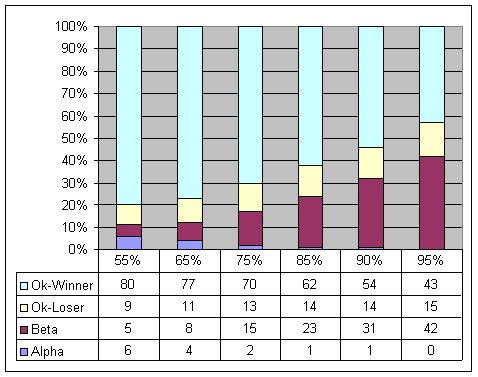 |
This chart shows that as the need for minimizing dog stores increases, the likelihood of missed opportunities also increases.At a 95% confidence interval, there would be no dog stores, but 42% of the rejected deals would have been successful.At a 55% confidence interval, only 5% of the successful stores would be rejected, but 6% of the stores would be underperformers.Each company will have its own risk profile, and these metrics will be used in conjunction with other data and extensive review processes before a check is written.
What's accurate enough for different types of decisions?
The need for an accurate sales forecast varies depending on the use of the forecast.Here are several applications of sales forecasts and the required accuracy for good decisions:
| Decision Type |
Required Accuracy |
| Market
Planning
(how many stores to put in a market and where) |
Moderate |
| Site
screening
(does a site meet the minimum criteria for consideration) |
Moderate |
| Deal
Underwriting (best estimate of sales volume prior to approving deal) |
High |
| Benchmarking
sales to identify stores that need operational attention |
Moderate |
| Category
management (tailoring product mix to trade area profile) |
Moderate |
Conclusion
The stakes are very high in the sales forecasting game.There are several companies and vendors that utilize best practices in model development and decision making processes, but there are others who do not.In order to be sure that you or your vendors are getting the best possible results, consider the following table of best practices benchmarks for evaluating your own organization or vendors.With a little care and effort, you can be on the road to happiness through better sales forecasting!
Criteria
for Evaluating Sales Forecasting Practices
A company or vendor must have a
combination of experienced personnel, good methods, and quality
assurance to build and support predictive models for retail sales
forecasting.Also, the software used to run the model should fit well
into the workflow of the end users.Here is a checklist of items to
consider in assessing your prospects for success.
| Description | Benchmark |
| People |
|
| Leadership | At least 10 years experience in retail industry to ensure understanding of markets, business processes, best practices, and pitfalls |
| Project Managers | Combination of retail experience and modeling techniques to properly scope and review methods, variables, and results during model development |
| Modelers | Training in statistics, spatial analysis, data cleansing, methods specific to retail modeling, not just general predictive modeling |
| Methods | |
| Trade Areas | Variable size trade areas based on analysis of customer data, drive time or drive distance |
| Demand Estimates | Model uses distance to store, competition, sister stores, and store characteristics SIMULTANEOUSLY at the demand unit level (e.g. block group) to estimate propensity to buy at a particular concept |
| Site Characteristics | Experience with quantifying these highly subjective factors and using surveys in models |
| Competition | Understanding of difference of direct and indirect competition and methods of estimating or using management judgment to assign variable strengths |
| Spatial Interaction models | Use of spatial interaction to estimate probability of patronage based on convenience, both for competitors and sister stores; use these variables in predictive model |
| Confidence Intervals | Produce estimates that include a confidence interval that can be used to establish a minimum sales threshold |
| Explainable methods | No step in the process should be impossible to relate to known retail market dynamics (often happens with neural nets) |
| Consideration of store maturity | Sample selection should not use stores that have not matured; sales estimates should include an estimated "ramp up" based on analysis of open dates and sales history |
| Quality Assurance | |
| Documentation of all steps and calculations in modeling process | Methodology document available to customer |
| Project Team | Domain experts should be involved in process design, variable selection, and review of each critical step in model development and final presentation to customer |
| Goodness of Fit | Each key "sub-model" (e.g.Trade Area Size estimator, demand model, site characteristics) should have measure of "goodness of fit" to guide customer in understanding reliability of model |
| Accuracy |
Overall predictive
power of model should
be measured in both Mean Absolute Precent Error and ability to
correctly select winners and losers based on a specified confidence
interval |
>
From Our Homepage
Saying Farewell to an Amazing Journey
Communicating with Maps
Is There a GIS Career Ladder?
What does it mean to be geospatially smart? Series
Ways Real Estate and Property Developers Utilize Melissa GeoData for Data-Driven Decisions
Unlocking Value From Daily Satellite Imagery and Insights
Maximizing the Value of Your Address Data with Geo Addressing
How Indoor Mapping Enhances the Security of Smart Buildings
Look Ahead: AI, Location Intelligence and Efficiency
Collaboration Takes on Sea Level Rise & Dynamic Technology Environments
Brownies for Brownfields
Has Everything Been Mapped Already?
How Is Data Literacy Changing in an Artificial Intelligence Landscape
Portfolios for GIS Professionals: More Than Just Maps
How to Create a Distance Matrix in QGIS - A Step-by-Step Guide
7 Ideas for Bringing GIS into the K-12 Classroom
The Geography of Movement