In the areas of predictive
analytics, it is considered contemporary
technology to be able to visualize current conditions, events and data
and then predict what may be the outcome to unforeseen changes or new
developments.This allows for better strategic planning and scenario
modeling that is based on estimates of the projection happening, or
not, and then being able to visualize the results.
In a number of respects, this is the business version of the situational awareness initiatives being put forth by the military (see Geoint 2005) that are focused on being able to see what is going on, what went on and what is going to go on.The idea is that if you understand the situation, you know what to do about it, or at least have a starting point.
While there are several approaches to creating visualization, a basic difference between products is their scope and flexibility.A product that provides several types of flexible visual insight that can allow for scenario modeling is DecisionSite™ from Spotfire.
DecisionSite™ does the required analysis, number crunching and analysis, but the real focus is visualization.What initially seems like very complex graphs and charts, as would be expected in a traditional BI dashboard, soon become clear you realize you are seeing the same data express in several different ways and it becomes very understandable.In the case of DecisionSite™, this also can include the spatial or locational perspective.This product has a multitude of facets and is used in a number of areas like the chemical industry and life sciences, production measurement, sales and marketing and even military intelligence.
DecisionSite™ can display the usual BI dashboard ability to display your data, sort through columns and rows and then display the data graphically. This is an example of that ability.
But the important thing is that it can do far more.One of their example applications is a pharmaceutical company working on a new product and needing to see alternatives and potential outcomes of R & D.The DecisionSite™ lets them see what is going to work and what isn't, and then hopefully, be able to take years and millions of dollars out of the product creation process.
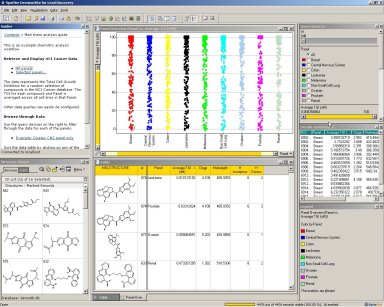
This graphic is an example of that type of research with multiple compounds and how effective they are at inhibiting cancer cell growth. Note, that here is displayed not just a graphic, but several molecular compounds and their relative data.In the upper right hand corner are selection buttons for each type of cancer so the display can be pointed to a specific cancer.
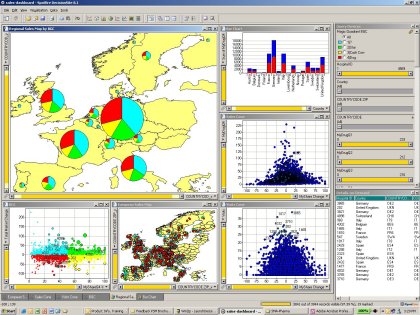
A more traditional area might be sales and marketing and answering the typical question of how are we doing in our various markets? This is an opportunity to bring in not just charts and graphs, but combine them with maps as one might do in a GIS to show the spatial aspects of performance data.The difference is the ability to traverse multiple data sets in real time (via the sliders in the upper right hand corner), and see the data and the relative geographies at the same time.
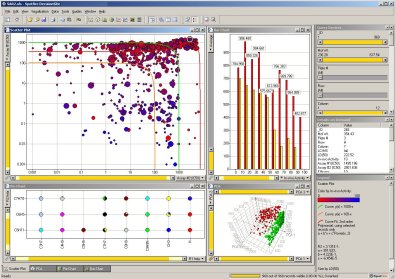
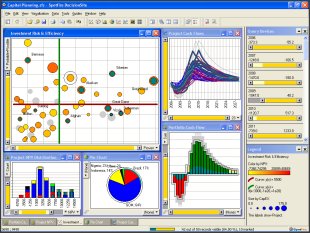
Energy production another area where geography matters .But geography in this case is virtual and represented by thematic symbols.This allows not only the ability to answer "where", but it includes the ability to assess the relative financial risk over time.Using the slider bars in the upper right hand corner, we can "tune" the visualization for various future financial risk and potential yield scenarios.This example is actually a financial tool for evaluating Net Present Value and Cash Flow.Perhaps visualization can make accounting fun.
To use an old adage, "seeing is believing" and visualization like this, coupled with scenario modeling will be the keys to 21st century business.Because, if you can't see what is happening, you probably really don't understand it.In today's world, knowledge continues to be power, and understanding in the key to acquiring knowledge, and having knowledge allows for better and more informed decisions.Remember, if you can't see it, it doesn't mean it isn't there.
For more information contact;
Spotfire, U.S.
212 Elm Street
Somerville, MA 02144
Phone: +1 617 702.1600
Fax: +1 617 702.1700
Toll-Free: +1 800 245.4211
www.spotfire.com
In a number of respects, this is the business version of the situational awareness initiatives being put forth by the military (see Geoint 2005) that are focused on being able to see what is going on, what went on and what is going to go on.The idea is that if you understand the situation, you know what to do about it, or at least have a starting point.
While there are several approaches to creating visualization, a basic difference between products is their scope and flexibility.A product that provides several types of flexible visual insight that can allow for scenario modeling is DecisionSite™ from Spotfire.
DecisionSite™ does the required analysis, number crunching and analysis, but the real focus is visualization.What initially seems like very complex graphs and charts, as would be expected in a traditional BI dashboard, soon become clear you realize you are seeing the same data express in several different ways and it becomes very understandable.In the case of DecisionSite™, this also can include the spatial or locational perspective.This product has a multitude of facets and is used in a number of areas like the chemical industry and life sciences, production measurement, sales and marketing and even military intelligence.
DecisionSite™ can display the usual BI dashboard ability to display your data, sort through columns and rows and then display the data graphically. This is an example of that ability.
 |
| Click for larger image |
But the important thing is that it can do far more.One of their example applications is a pharmaceutical company working on a new product and needing to see alternatives and potential outcomes of R & D.The DecisionSite™ lets them see what is going to work and what isn't, and then hopefully, be able to take years and millions of dollars out of the product creation process.
 |
| Click for larger image |
This graphic is an example of that type of research with multiple compounds and how effective they are at inhibiting cancer cell growth. Note, that here is displayed not just a graphic, but several molecular compounds and their relative data.In the upper right hand corner are selection buttons for each type of cancer so the display can be pointed to a specific cancer.
A more traditional area might be sales and marketing and answering the typical question of how are we doing in our various markets? This is an opportunity to bring in not just charts and graphs, but combine them with maps as one might do in a GIS to show the spatial aspects of performance data.The difference is the ability to traverse multiple data sets in real time (via the sliders in the upper right hand corner), and see the data and the relative geographies at the same time.
 |
| Click for larger image |
Energy production another area where geography matters .But geography in this case is virtual and represented by thematic symbols.This allows not only the ability to answer "where", but it includes the ability to assess the relative financial risk over time.Using the slider bars in the upper right hand corner, we can "tune" the visualization for various future financial risk and potential yield scenarios.This example is actually a financial tool for evaluating Net Present Value and Cash Flow.Perhaps visualization can make accounting fun.
 |
| Click for larger image |
To use an old adage, "seeing is believing" and visualization like this, coupled with scenario modeling will be the keys to 21st century business.Because, if you can't see what is happening, you probably really don't understand it.In today's world, knowledge continues to be power, and understanding in the key to acquiring knowledge, and having knowledge allows for better and more informed decisions.Remember, if you can't see it, it doesn't mean it isn't there.
For more information contact;
Spotfire, U.S.
212 Elm Street
Somerville, MA 02144
Phone: +1 617 702.1600
Fax: +1 617 702.1700
Toll-Free: +1 800 245.4211
www.spotfire.com
From Our Homepage
Saying Farewell to an Amazing Journey
Communicating with Maps
Is There a GIS Career Ladder?
What does it mean to be geospatially smart? Series
Ways Real Estate and Property Developers Utilize Melissa GeoData for Data-Driven Decisions
Unlocking Value From Daily Satellite Imagery and Insights
Maximizing the Value of Your Address Data with Geo Addressing
How Indoor Mapping Enhances the Security of Smart Buildings
Look Ahead: AI, Location Intelligence and Efficiency
Collaboration Takes on Sea Level Rise & Dynamic Technology Environments
Brownies for Brownfields
Has Everything Been Mapped Already?
How Is Data Literacy Changing in an Artificial Intelligence Landscape
Portfolios for GIS Professionals: More Than Just Maps
How to Create a Distance Matrix in QGIS - A Step-by-Step Guide
7 Ideas for Bringing GIS into the K-12 Classroom
The Geography of Movement