The dictionary defines data as "factual information,
especially information organized for analysis or used to reason or make
decisions." GISs (from simple to advanced) generate and consume data at
a voracious rate, but we, as professionals, don’t spend much time
thinking about the many dimensions of data. Data streams have two
dimensions.
Generalization. The first dimension is generalization. Generalization makes the data handling process easier and more efficient. We usually arrive at data generalization through classification and other descriptive statistical operations such as averaging. Generalizations are models of reality that help us make decisions. We’ve all heard the story about the statistician who drowned in a pond with an average depth of 1 meter. She just happened to step in the 4 meter hole! As long as we fly above the height of Everest, we can never hit a mountain; but what kind of data do we need to land the plane?
Specificity. The second dimension of data is specificity. We need a data stream of precise elevations (x, y, and z) along our flight path to keep from slamming into mountains along the way. As long as we are flying over the ocean, just keep it above sea level. Flying into San Diego International requires a great deal more specificity. When we generalize, we reduce the data set but lose specificity. When we disaggregate a data set, we greatly increase the cost and time required to manipulate the data; but specificity is required to find the holes and mountains. Specificity is the key to finding new customers, new products and viable retail sites.
As individuals, we American consumers are approaching the 300 million population mark. Each one of us is different. Some of our consumption patterns can be generalized, but others reflect highly individualized tastes. Bricks and mortar site location decisions try to locate new stores in the midst of individual consumers who have the greatest probability of shopping at those stores and buying their products. Direct mail marketing must focus on specific people to hold down costs and increase response rates. Almost immediately, however, we generalize individuals up into households (120 million and counting). This cuts the data handling in half and makes intuitive sense because many consumption decisions are made and/or approved at the household level.
Individuals and households are further generalized by geography. The census releases counts, averages and medians for geographies such as block groups and tracts. This is the "birds of a feather" approach that has dominated site location and direct marketing for a long time. Psychographics companies have, in turn, sought to bring specificity into the mix with segmentation models, but this is another kind of generalization that takes 120 million households and categorizes them into 50+ clusters with cute names. The underlying idea is sound. It highlights the fact that households within the same block group, while alike in many ways, may also be quite different. However, the clusters are often generalized back up to the block group level based on the dominant (most frequently occurring) cluster.
Given the increasing fragmentation of modern life, "householding" reduces granularity. Think of the fragmentation and granularity of media (hundreds of channels, web links, blogs, magazines, etc.) and you’ll understand what we mean. The media stream reaching teenagers will be almost completely different from that reaching their parents. New "gonzo marketing" programs are constantly being invented to reach fragmented markets, but scant attention has been paid to the locational dimensions of fragmentation.
Let’s explore what Location Intelligence (LI) can bring to the household data stream. How can LI mine useful specificity from generalized data? Let’s use the example of an individual consumer whose age, sex, income, occupation and education makes her, all other things being equal, an excellent prospect for our store and/or products. Her "demographics" represents a gross generalization and her "profile" may represent millions of individuals. In other words, we’ve already segmented her out of the general pack based on individual demographic characteristics, but that profile represents a gross generalization. Imagine our Ms. Demographic has a "prospect meter" that she carries around. The meter measures Ms. Demographic as a potential customer along a continuum from 0% to 100% or from "cold to hot."
Next, let’s change Ms. Demographic’s location. Visualize her as a dot on a map that you can move anywhere in the United States. As you move the dot around the map, the prospect meter changes. This is kind of like moving our non-swimmer statistician around our theoretical pond. As long as she’s in knee deep water, she’s not a candidate for a flotation vest; but move her closer and closer to the 4 meter hole and she becomes a better "demographic" not because of changes in income or education, but because of location.
LI enhances data in ways that can only be obtained through geo-spatial processes. No other data model can add location intelligence. So the prospect meter score is a function of location - or where Ms. Demographic is, relative to other important things. In other words, spatial relationships can turn a hot customer cold and vice versa.
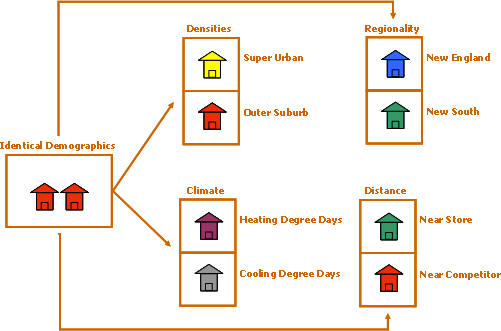
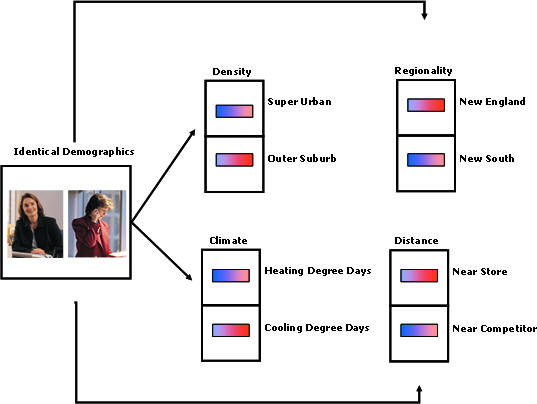
Proxix Solutions’ intensive statistical research has involved (metaphorically) moving the dot around the map and noting the changes in the prospect meter relative to other spatial factors. These factors, in turn, can be codified so that consumers who look identical in terms of individual demographics (general) will be quite different (specific) depending on their location. Our research indicates that the following spatial variables (plus some other, more proprietary ones) are extremely important drivers of the prospect meter score.
One of the most obvious factors for bricks and mortar operations is distance to a store. Demographics don’t matter if there’s no convenient store for a given customer. Put down a new location and the prospect meter begins to glow hot as an inverse function of distance; the closer the better. Plop down a good competitor and the meter will cool off. We have also found that distance-to-store is a valid response predictor for direct mail applications. Just being familiar with a physical store increases the mail-web/order likelihood.
Residential population density class (Proxix has created eight, from super-urban to farm-ranch) is also a powerful factor. While the demographics of our mythical customer don’t change, Ms. Super-Urban is an entirely different customer than Ms. Farm-Ranch. Lot size, for example, is a powerful predictor of lawn/garden spending. Furthermore, the spending patterns and market areas of physical stores vary considerably with both residential and daytime population density classes.
Regionality is another extremely important factor. We can find Ms. Demographic in the "outer suburbs" density class, but Ms. Demographic in the outer suburbs of San Diego is a different consumer than her sister in the outer suburbs of Atlanta. We begin with a set of proprietary county-based regions for the United States and adjust them for each specific client using cluster analysis and other statistical techniques. We also add weather/climate factors such as heating/cooling degree days and days of sunshine. Location matters! Proxix’s analysis of casino customers prompted us to create a liberal/conservative religious score based on the mix of denominations and church attendance across the country. Individuals may be fairly liberal, but if they live in a religiously conservative area, their outlooks and habits are affected in subtle ways.
"All this makes intuitive sense, we know this," I’ve had executives tell me. Sure, we know this. But the real question is, are we using this data to make decisions? Ultimately, location intelligence is about science… and "if it ain’t numbers, it ain’t science." Intuition isn’t enough. We need to use hard data to make scientific decisions and location data is often a missing element from the total data stream.
Back in one January years ago, I had a vice president of a laid-back, high-tech company in Miami tell me, "Location doesn’t matter." I bet him $1,000 that I could prove to him that location does matter. All he had to do was stand on a street corner for one hour in his shorts and Hawaiian shirt the following day, but I’d pick the street corner. "Sure, what corner?" "Kellogg and Roberts, right at the bridge," I replied. "Where’s that?" "St. Paul, Minnesota." He declined to take the bet. Use Location Intelligence data to pick the right corner!
Generalization. The first dimension is generalization. Generalization makes the data handling process easier and more efficient. We usually arrive at data generalization through classification and other descriptive statistical operations such as averaging. Generalizations are models of reality that help us make decisions. We’ve all heard the story about the statistician who drowned in a pond with an average depth of 1 meter. She just happened to step in the 4 meter hole! As long as we fly above the height of Everest, we can never hit a mountain; but what kind of data do we need to land the plane?
Specificity. The second dimension of data is specificity. We need a data stream of precise elevations (x, y, and z) along our flight path to keep from slamming into mountains along the way. As long as we are flying over the ocean, just keep it above sea level. Flying into San Diego International requires a great deal more specificity. When we generalize, we reduce the data set but lose specificity. When we disaggregate a data set, we greatly increase the cost and time required to manipulate the data; but specificity is required to find the holes and mountains. Specificity is the key to finding new customers, new products and viable retail sites.
As individuals, we American consumers are approaching the 300 million population mark. Each one of us is different. Some of our consumption patterns can be generalized, but others reflect highly individualized tastes. Bricks and mortar site location decisions try to locate new stores in the midst of individual consumers who have the greatest probability of shopping at those stores and buying their products. Direct mail marketing must focus on specific people to hold down costs and increase response rates. Almost immediately, however, we generalize individuals up into households (120 million and counting). This cuts the data handling in half and makes intuitive sense because many consumption decisions are made and/or approved at the household level.
Individuals and households are further generalized by geography. The census releases counts, averages and medians for geographies such as block groups and tracts. This is the "birds of a feather" approach that has dominated site location and direct marketing for a long time. Psychographics companies have, in turn, sought to bring specificity into the mix with segmentation models, but this is another kind of generalization that takes 120 million households and categorizes them into 50+ clusters with cute names. The underlying idea is sound. It highlights the fact that households within the same block group, while alike in many ways, may also be quite different. However, the clusters are often generalized back up to the block group level based on the dominant (most frequently occurring) cluster.
Given the increasing fragmentation of modern life, "householding" reduces granularity. Think of the fragmentation and granularity of media (hundreds of channels, web links, blogs, magazines, etc.) and you’ll understand what we mean. The media stream reaching teenagers will be almost completely different from that reaching their parents. New "gonzo marketing" programs are constantly being invented to reach fragmented markets, but scant attention has been paid to the locational dimensions of fragmentation.
Let’s explore what Location Intelligence (LI) can bring to the household data stream. How can LI mine useful specificity from generalized data? Let’s use the example of an individual consumer whose age, sex, income, occupation and education makes her, all other things being equal, an excellent prospect for our store and/or products. Her "demographics" represents a gross generalization and her "profile" may represent millions of individuals. In other words, we’ve already segmented her out of the general pack based on individual demographic characteristics, but that profile represents a gross generalization. Imagine our Ms. Demographic has a "prospect meter" that she carries around. The meter measures Ms. Demographic as a potential customer along a continuum from 0% to 100% or from "cold to hot."
Next, let’s change Ms. Demographic’s location. Visualize her as a dot on a map that you can move anywhere in the United States. As you move the dot around the map, the prospect meter changes. This is kind of like moving our non-swimmer statistician around our theoretical pond. As long as she’s in knee deep water, she’s not a candidate for a flotation vest; but move her closer and closer to the 4 meter hole and she becomes a better "demographic" not because of changes in income or education, but because of location.
LI enhances data in ways that can only be obtained through geo-spatial processes. No other data model can add location intelligence. So the prospect meter score is a function of location - or where Ms. Demographic is, relative to other important things. In other words, spatial relationships can turn a hot customer cold and vice versa.
Proxix Solutions’ intensive statistical research has involved (metaphorically) moving the dot around the map and noting the changes in the prospect meter relative to other spatial factors. These factors, in turn, can be codified so that consumers who look identical in terms of individual demographics (general) will be quite different (specific) depending on their location. Our research indicates that the following spatial variables (plus some other, more proprietary ones) are extremely important drivers of the prospect meter score.
One of the most obvious factors for bricks and mortar operations is distance to a store. Demographics don’t matter if there’s no convenient store for a given customer. Put down a new location and the prospect meter begins to glow hot as an inverse function of distance; the closer the better. Plop down a good competitor and the meter will cool off. We have also found that distance-to-store is a valid response predictor for direct mail applications. Just being familiar with a physical store increases the mail-web/order likelihood.
Residential population density class (Proxix has created eight, from super-urban to farm-ranch) is also a powerful factor. While the demographics of our mythical customer don’t change, Ms. Super-Urban is an entirely different customer than Ms. Farm-Ranch. Lot size, for example, is a powerful predictor of lawn/garden spending. Furthermore, the spending patterns and market areas of physical stores vary considerably with both residential and daytime population density classes.
Regionality is another extremely important factor. We can find Ms. Demographic in the "outer suburbs" density class, but Ms. Demographic in the outer suburbs of San Diego is a different consumer than her sister in the outer suburbs of Atlanta. We begin with a set of proprietary county-based regions for the United States and adjust them for each specific client using cluster analysis and other statistical techniques. We also add weather/climate factors such as heating/cooling degree days and days of sunshine. Location matters! Proxix’s analysis of casino customers prompted us to create a liberal/conservative religious score based on the mix of denominations and church attendance across the country. Individuals may be fairly liberal, but if they live in a religiously conservative area, their outlooks and habits are affected in subtle ways.
"All this makes intuitive sense, we know this," I’ve had executives tell me. Sure, we know this. But the real question is, are we using this data to make decisions? Ultimately, location intelligence is about science… and "if it ain’t numbers, it ain’t science." Intuition isn’t enough. We need to use hard data to make scientific decisions and location data is often a missing element from the total data stream.
Back in one January years ago, I had a vice president of a laid-back, high-tech company in Miami tell me, "Location doesn’t matter." I bet him $1,000 that I could prove to him that location does matter. All he had to do was stand on a street corner for one hour in his shorts and Hawaiian shirt the following day, but I’d pick the street corner. "Sure, what corner?" "Kellogg and Roberts, right at the bridge," I replied. "Where’s that?" "St. Paul, Minnesota." He declined to take the bet. Use Location Intelligence data to pick the right corner!
 |
 |
From Our Homepage
Saying Farewell to an Amazing Journey
Communicating with Maps
Is There a GIS Career Ladder?
What does it mean to be geospatially smart? Series
Ways Real Estate and Property Developers Utilize Melissa GeoData for Data-Driven Decisions
Unlocking Value From Daily Satellite Imagery and Insights
Maximizing the Value of Your Address Data with Geo Addressing
How Indoor Mapping Enhances the Security of Smart Buildings
Look Ahead: AI, Location Intelligence and Efficiency
Collaboration Takes on Sea Level Rise & Dynamic Technology Environments
Brownies for Brownfields
Has Everything Been Mapped Already?
How Is Data Literacy Changing in an Artificial Intelligence Landscape
Portfolios for GIS Professionals: More Than Just Maps
How to Create a Distance Matrix in QGIS - A Step-by-Step Guide
7 Ideas for Bringing GIS into the K-12 Classroom
The Geography of Movement