Abstract
The conduct of hydrocarbon exploration and production activities in environmentally sensitive areas is a good reason for developing activities designed to diagnose the condition of each area of operations and establish mechanisms for preventing potential incidents.
In addition, a methodology relating the individual components of each such incident to their spatial area of occurrence can be established from a coordinated analysis of environmental incidents (as derived from statistics, charges, certificates, documents, databases).
A general framework is thus provided to deal with incidents occurring in a given geographical setting and to establish programs designed to prevent their repeated occurrence or mitigate the impact of their occurrence, if any.
The environmental sanitation map resulting from these programs is a dynamic working tool that may provide significant assistance to production management.
INTRODUCTION
Based on an analysis of environmental
incidents in the Sierra Barrosa-Aguada Toledo field, repeated occurrence
of the same causes, type of incidents, and damaged facilities was detected
as from October 2000.As a result, on that date, the Environmental Sanitation
Function was created for the area.
At an early stage, it was designed to keep a systematic image-based record aimed at finding out any environmental incidents occurring in the field of operations.The records should also serve as a responding tool to address potential claims made by surface area owners and/or deal with inquiries made by application authorities in charge of enforcing the legal framework for environmental protection.
The most frequent causes of environmental
incidents were found to be related to internal material corrosion, errors
made when performing maintenance tasks, and human error.The most frequent
types of incidents included breakage of parts and components, sprites,
liquid spills and/or old environmental liabilities.Well locations, batteries,
pipelines, and byroads were among the most adversely affected facilities.
Any of the foregoing incidents in
the field directly affects such environmental factors as air, water, vegetation,
and soil.This article focuses on incidents which particularly impact vegetation,
water, and soil.
METHODOLOGY
The methodology used involves an
analysis of the geographical distribution of environmental incidents and
their relationship with production facilities, protected areas or areas
of environmental interest and surface area owners.
At an early stage, the study consists of documenting and diagnosing the factors involved in each incident (causes, characteristics, and facilities).This stage of the survey includes accurate measurements, use of a global positioning system (GPS), construction of base maps, and photographic record of the incident.
Assignments are established based on the above items.These include damage assessment and documentation, sanitation works, bioremediation, soil reclamation, and landscape restoration.
A second step of the analysis involves correlating existing database records with newly acquired data.Test cases, geographical proximity, event-case-cause and case-occurrence-cause ratios are used for the correlations.
The main steps of the analysis technique
proposed are shown in Figure 1.
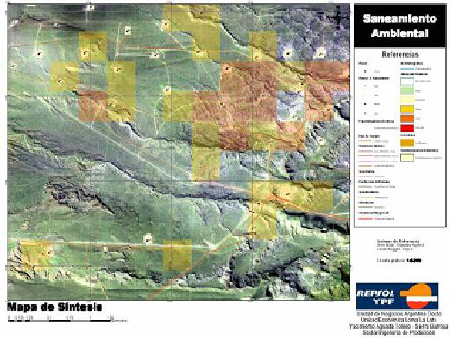 Using this methodology, tesserae are
established that cover each total study area.From these tesserae, a regional
synthetic map showing environmental conditions can be constructed.
Using this methodology, tesserae are
established that cover each total study area.From these tesserae, a regional
synthetic map showing environmental conditions can be constructed.
The map developed for Sierra Barrosa-Aguada Toledo serves to provide a visual and a geographical record of environmental incidents.It is a permanently searchable tool and at the same time it allows for establishing effective relationships between incident location and incident type, magnitude, and frequency.
The sequence of operations after an environmental incident is conducted based on a pre-established methodology:
- Incident location, visual record, and assessment of damage
- Report to application authority
- Entering the incident on the geographical database and determining the nature of the incident (type, cause, etc.)
- Environmental sanitation works
- Determination of the degree of harm to impacted sites and potential probability of further incidents
THE REGIONAL STATUS MAP
Based on effective records and controls,
a regional environmental map is obtained from the foregoing prevention
and sanitation operations.On this map, the total mapped land is ranked
from 1 to 6 depending on the degree of risk (from lowest to highest risk
level).
ASSESSMENT OF DERIVED RISKS
For the purposes hereof, risk is
the possibility of occurrence of an incident that is evaluated based on
potential adverse effects that will affect humans, fauna, flora, property,
facilities, and the environment.
For this project, risk is viewed
in a geographical display of dynamic surface tesserae from which the environmental
map is obtained.Map dynamics is dependent upon the moving nature of the
different damaged zones or study areas.Thus, areas can be represented
as involving a lower or a higher degree of harm or potential impact risk
from past incidents and/or from incidents that are likely to occur in the
field.
Derived and/or potential risks have
an economic influence on the conduct of the exploitation business.Thus,
the map recording these risks becomes a useful tool for determining either
actual or potential deviations in the annual budget of the production unit.
The condition of production facilities
can be defined based on any risk incidence on said production facilities.
IMPLICATION
The environmental map is a summary
of the information collected from all incidents entered on the database.
The results of the interaction between the different elements studied (incidents
vs.water, incidents vs.soil, etc.) together with their processing by
use of statistical series or probabilistic operations are shown in the
environmental map.A tool is thus available that contributes to the determination
and anticipation of operations.Under these conditions, operations can
be programmed so as to minimize their environmental impact or efforts can
be concentrated to prevent it if permitted by circumstances.
SYNTHESIS MAP
One can determine six potential
harm levels, a risk probability surface, an event proximity surface by
frequency of events, a sequence of events network, an occurrence pathway,
and an incident grouping surface by cases gathering, integrating and ranking
the different possible combinations
of environmental damage in the total
field area.
Four kinds of derived actions can be determined on the basis of the synthesis map:
- Identification of the probability of occurrence of a new incident and subsequent scheduling of corrective action.
- Monitoring the condition of production facilities and the actions required for their maintenance.
- Determination of the action plan for monitoring works and tasks inherent in the conduct of business.
- Rapid and effective response to requirements from application authorities, individuals or corporations which are the owners of the land where the activity is conducted.
CONCLUSIONS
The environmental sanitation map
and the methodology developed to construct it are a contribution to the
knowledge of environmental incidents and liabilities, their prevention,
and environmental protection.
It proposes a simple, flexible and
movable scheme that can be incorporated into the business process and management
of any field, regardless of its structure and size.
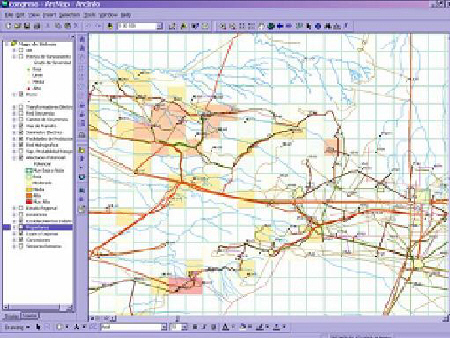
As a tool based on the use of a Geographical Information System, it allows for the integration of data from several sources which are sometimes heterogeneous in both format and origin.
Thanks to the advantages of thematic mapping techniques, information can be kept as a dynamic system.Besides, it is possible to interact with all the sectors that are directly or indirectly involved with major environmental issues.
Authors:
Alejandro Iparraguirre
REPSOL-YPF
Talero 360 (8300) - Neuquen - Argentina
Fax: +54299-4492800 Int: 42760
Tel: +54299-4492800 Int: 45303
Email: aiparrag@repsolypf.com
José Martín Catalini
SUMICOMP S.R.L.
Santa Fe 53 - 3 - 'E' (8300) - Neuquen
- Argentina
Fax: +54299-4480360
Tel: +54299-4480360
Email: jcatalinif@repsolypf.com