Yesterday we were given a briefing by Jim Metcalf,
director of SAS technology platform
product management.He provided an overview of the GIS capability inside the SAS BI Server and the
SAS BI Enterprise (EBI) Server.These two products came on the market
March 1, and were launched at the SAS user group meeting on
April 11.Metcalf first highlighted that SAS has had a relationship
with ESRI since 2002, when the SAS Bridge for ESRI was released.This new capability is also based on the very solid ESRI relationship.
The SAS Web OLAP Viewer for JAVA 2.1 that resides within SAS' BI servers, is GIS enabled.In October of this year, other viewers SAS uses will also be GIS enabled.The company will also release a public API that allows users to build their own applications based on this integration.Currently the company is marketing this capability to SAS9 users.
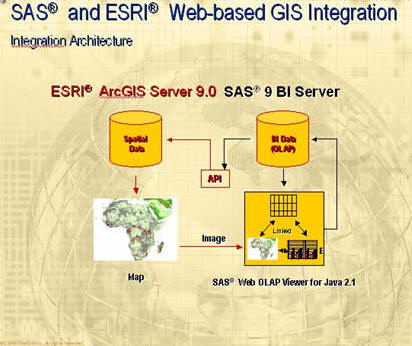
This new integrated functionality is web-based with a zero-download (e.g.you don't need a plug-in) client.The basic architecture looks like this.
A primary part of the integration is the ability to create a tiered
functionality for various levels and skill sets within the enterprise.
While SAS has had the "bridge" to ESRI since 2002, this new
combination allows for almost seamless integration and bi-directional
movement of data from the SAS Business Intelligence environment to the
ESRI platform.From the user's perspective, this is done through
the SAS Web OLAP Viewer for JAVA 2.1, with the ties to the two servers.
Key functionality from within the SAS Viewer includes the following.
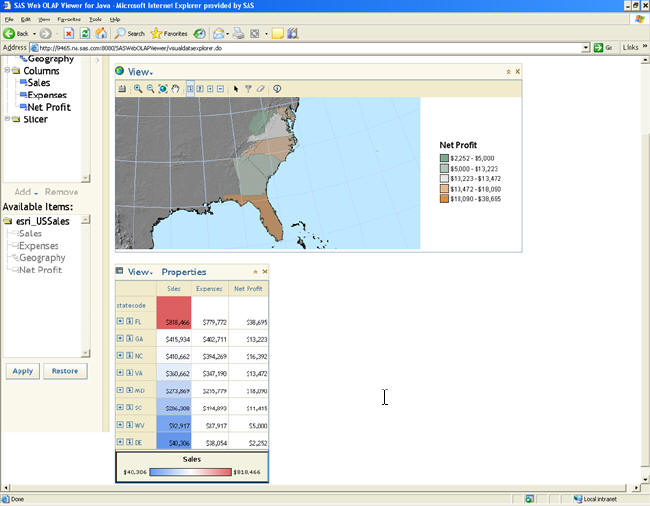
A second representation of data that is so obvious that it has been almost totally overlooked by others is the thematic cells of a data table.This is a very cool way to represent data in a thematic table using the same symbology as on a map.
The ability to move seamlessly from data, statistically processed data and visualization both in maps and in other graphics, moves closer to the goal of extending the insight to what is actually happening in the enterprise.As these tools and some of the other things that SAS intends to bring into play appear, they will definitely extend the power to know.The objective of this integration is clearly to form a bi-directional link between BI and spatial data.
The SAS Web OLAP Viewer for JAVA 2.1 that resides within SAS' BI servers, is GIS enabled.In October of this year, other viewers SAS uses will also be GIS enabled.The company will also release a public API that allows users to build their own applications based on this integration.Currently the company is marketing this capability to SAS9 users.
This new integrated functionality is web-based with a zero-download (e.g.you don't need a plug-in) client.The basic architecture looks like this.
 |
Key functionality from within the SAS Viewer includes the following.
- Web-based zero-download client that delivers OLAP query and reporting (e.g.a "map-enabled cube")
- Integrates with SAS BI and EBI Servers
- Associates cube structures with map layers
- GIS-enabled through integration with ESRI's ArcGIS 9.0
- Synchronizes OLAP and GIS map data exploration
- Pan and zoom
- Drill-up/drill-down
- Expands/collapses
- Select and identify region
- Filter by value, filter by region
- Filter and rank
- Create calculated measures
- Bookmark-save and return
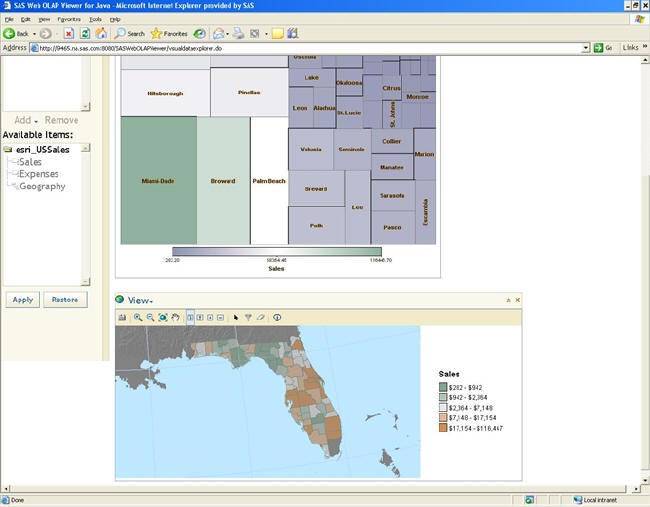 |
A second representation of data that is so obvious that it has been almost totally overlooked by others is the thematic cells of a data table.This is a very cool way to represent data in a thematic table using the same symbology as on a map.
 |
The ability to move seamlessly from data, statistically processed data and visualization both in maps and in other graphics, moves closer to the goal of extending the insight to what is actually happening in the enterprise.As these tools and some of the other things that SAS intends to bring into play appear, they will definitely extend the power to know.The objective of this integration is clearly to form a bi-directional link between BI and spatial data.
From Our Homepage
Saying Farewell to an Amazing Journey
Communicating with Maps
Is There a GIS Career Ladder?
What does it mean to be geospatially smart? Series
Ways Real Estate and Property Developers Utilize Melissa GeoData for Data-Driven Decisions
Unlocking Value From Daily Satellite Imagery and Insights
Maximizing the Value of Your Address Data with Geo Addressing
How Indoor Mapping Enhances the Security of Smart Buildings
Look Ahead: AI, Location Intelligence and Efficiency
Collaboration Takes on Sea Level Rise & Dynamic Technology Environments
Brownies for Brownfields
Has Everything Been Mapped Already?
How Is Data Literacy Changing in an Artificial Intelligence Landscape
Portfolios for GIS Professionals: More Than Just Maps
How to Create a Distance Matrix in QGIS - A Step-by-Step Guide
7 Ideas for Bringing GIS into the K-12 Classroom
The Geography of Movement