The Federal Highway Administration (FHWA) is
emphasizing using low-cost visualization tools to help the public gain
an understanding of transportation-related issues. Lindsay Banks and
Mark Sarmiento of the FHWA hosted a Web conference last week (April 24)
titled "Low-cost Internet-based Geospatial Technologies for
Transportation." About 150 people attended. The session
introduced transportation professionals to tools that are readily
available to them, ways in which these tools can be used, and reasons
why they are useful. Sarmiento made this point: "The general public is
becoming more aware of these tools and we think they're going to expect
us to be able to use them as visualization tools."
Banks and Sarmiento highlighted the use of Google Earth (primarily), as well as ESRI's ArcGIS Explorer, NASA World Wind, Skyline Software's Terra Explorer and Microsoft Virtual Earth, as products that can be used to communicate transportation-related information to the general public via the Web. They stressed that these tools do not replace GIS tools used for transportation-related analysis tasks, but serve as complements to them.
The next speaker was Craig Casper with the Pikes Peak Area Council of Governments (PPACG), which serves 15 local and county government agencies in the greater Colorado Springs, Colorado area. He discussed how his agency combined GIS and other data into a format viewable by the public. "What we're trying to do is use Google Earth to communicate with the public - it doesn't replace GIS analysis," he said.
Systems integrator CH2M HILL helped the PPACG convert that organization's transportation-related data to KML (Keyhole Markup Language) files, the format used by Google Earth. "They helped us make it [the data] look pretty and more usable," he said. The Citizen Advisory Committee provided overwhelmingly positive reaction, he reported.
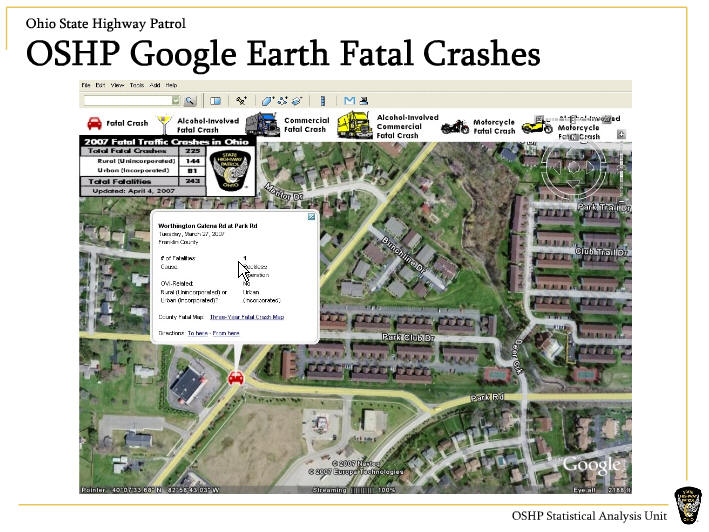
Gary Macklis of the Ohio State Highway Patrol (OSHP) discussed the agency's use of Google Earth to distribute data about fatal accidents to the public. The agency is a relatively new user of GIS, starting in early 2004, and Macklis started manually mapping traffic fatalities later that year. He created PDF-format maps and posted them to the OSHP's website. Macklis explained that the next step, posting the fatality data in Google Earth, went live in May 2006 as part of a Memorial Day media push. During May the map mashup of fatalities was the 15th most visited page on the site.
Webcast attendees asked very practical questions, including how you license and pay for these kinds of tools - per seat, per agency, per popped-up ad, etc. - and how you prepare data to be used with these tools. There was no resistance to the idea that using low-cost tools to communicate data via the Internet is a good thing, just questions about how to do it.
Banks and Sarmiento highlighted the use of Google Earth (primarily), as well as ESRI's ArcGIS Explorer, NASA World Wind, Skyline Software's Terra Explorer and Microsoft Virtual Earth, as products that can be used to communicate transportation-related information to the general public via the Web. They stressed that these tools do not replace GIS tools used for transportation-related analysis tasks, but serve as complements to them.
The next speaker was Craig Casper with the Pikes Peak Area Council of Governments (PPACG), which serves 15 local and county government agencies in the greater Colorado Springs, Colorado area. He discussed how his agency combined GIS and other data into a format viewable by the public. "What we're trying to do is use Google Earth to communicate with the public - it doesn't replace GIS analysis," he said.
Systems integrator CH2M HILL helped the PPACG convert that organization's transportation-related data to KML (Keyhole Markup Language) files, the format used by Google Earth. "They helped us make it [the data] look pretty and more usable," he said. The Citizen Advisory Committee provided overwhelmingly positive reaction, he reported.
Gary Macklis of the Ohio State Highway Patrol (OSHP) discussed the agency's use of Google Earth to distribute data about fatal accidents to the public. The agency is a relatively new user of GIS, starting in early 2004, and Macklis started manually mapping traffic fatalities later that year. He created PDF-format maps and posted them to the OSHP's website. Macklis explained that the next step, posting the fatality data in Google Earth, went live in May 2006 as part of a Memorial Day media push. During May the map mashup of fatalities was the 15th most visited page on the site.
 |
Webcast attendees asked very practical questions, including how you license and pay for these kinds of tools - per seat, per agency, per popped-up ad, etc. - and how you prepare data to be used with these tools. There was no resistance to the idea that using low-cost tools to communicate data via the Internet is a good thing, just questions about how to do it.
From Our Homepage
Saying Farewell to an Amazing Journey
Communicating with Maps
Is There a GIS Career Ladder?
What does it mean to be geospatially smart? Series
Ways Real Estate and Property Developers Utilize Melissa GeoData for Data-Driven Decisions
Unlocking Value From Daily Satellite Imagery and Insights
Maximizing the Value of Your Address Data with Geo Addressing
How Indoor Mapping Enhances the Security of Smart Buildings
Look Ahead: AI, Location Intelligence and Efficiency
Collaboration Takes on Sea Level Rise & Dynamic Technology Environments
Brownies for Brownfields
Has Everything Been Mapped Already?
How Is Data Literacy Changing in an Artificial Intelligence Landscape
Portfolios for GIS Professionals: More Than Just Maps
How to Create a Distance Matrix in QGIS - A Step-by-Step Guide
7 Ideas for Bringing GIS into the K-12 Classroom
The Geography of Movement