A familiar scenario for most of us: an interruption in
our cable/Internet/phone service, a frenzied call to the cable
operator, a dismayed reaction when we hear that a technician will be
out to check on it between 9am and 5pm, two to three days out. However
aggravating that scenario may be, it's not actually dangerous, just
annoying. Let's consider a similar situation, but this time it's a
hospital that has a vital piece of medical equipment go down. Not only
does that impair the hospital's ability to effectively treat its
patients, it can also result in the loss of thousands if not millions
of dollars for every hour that the piece of machinery is down. The
hospital simply cannot afford to wait to get the equipment up and
running.

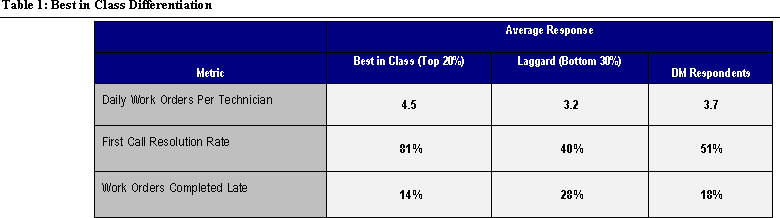
Responding to customer requests for faster service response times, as well as the need to enhance field technician productivity, Original Equipment Manufacturers (OEMs) and Independent Service Organizations (ISOs) are looking to develop effective schedule and dispatch processes to achieve these goals. These OEMs and ISOs are also looking to efficiently route their technicians to customer sites, so as to minimize travel and transit times. This comes at a vital time for these organizations. A recent Aberdeen research product, undertaken in partnership with Directions Media and entitled Service on Time, All the Time, found that nearly 21% of all work orders are completed late (18% for the Directions community, denoted in the figures as "DM Respondents") as against promised response times, necessitating corrective action.
Improved processes and support for field service are intended to ensure that the right technician gets to the right place at the right time. This addresses the issue of improving response times to customer requests. But having a technician arrive on time is worthless if he does not have the right parts or equipment to resolve the service issue on the first visit and needs to schedule a follow-up call (perhaps in another two days).
Therefore, Aberdeen's methodology for classifying best in class companies (best in class firms - top 20%, average - middle 50%, laggards - bottom 30%), which is based on a combination of key performance indicators relevant to field service and the improvements affected in these metrics over the last two years, looks not only at productivity metrics but also at those that document first time resolution. The combination of productivity and efficiency metrics positively affects service profits, which is vital to companies searching for alternative sources of income to supplement product-based revenues that are being shredded by the dual assault of globalization and commoditization.
Key strategies undertaken by best in class firms revolve around four pillars that Aberdeen identifies as key to operating service as a strategic profit center: process, organizational support, knowledge management and performance measurement.
Table 2 reveals that leading firms are taking a holistic approach to field service optimization. A notable differentiator between best in class and laggards firms is the existence of a senior-level champion with accountability for service-specific budgeting, forecasting and planning. Senior executives can also play a major role in removing strategic and budgetary roadblocks in decision making, especially when it comes to the addition of support staff or technology to assist post-sales service processes. Evaluation of performance is contingent on the existence of systems and metrics to measure field service productivity and efficiency. It is, therefore, of no surprise that leading firms are significantly more likely than laggards to have these systems in place.
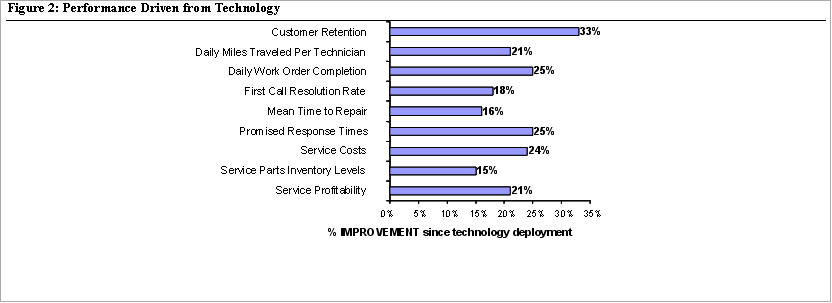
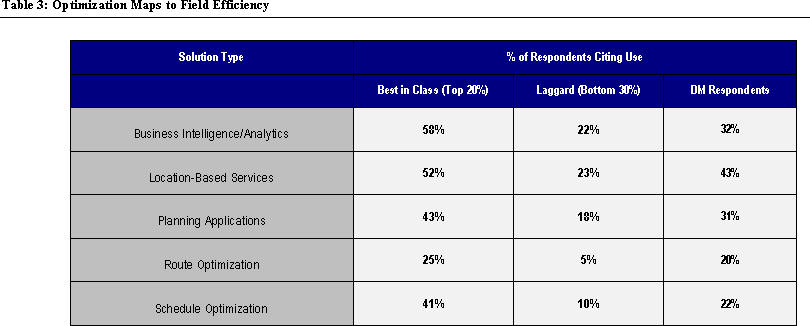
With this as a base, these companies are actively eyeing technology solutions (Table 3) to support their processes. Specific to field service optimization, these firms are four times as likely as laggards to have field scheduling solutions and five times as likely as laggards to leverage route optimization. The tangible benefits of schedule and route optimization solutions range from a 33% increase in customer retention to a substantial 24% reduction in overall service costs (Figure 2).
Leading firms are also actively leveraging location-based services to supercharge their routing solutions. These could range from automatic vehicle location services, to GPS-enabled in-cab mapping for technicians, to location-enabled mapping, which is one of the top inputs that firms consider when assigning field technicians via an optimized scheduling system.
On a final note, it is evident that leading firms are effectively supporting their field service organizations when it comes to the execution of optimized scheduling and routing strategies. But these firms also realize the need to proactively track, monitor and predict field resource needs. Thus, these firms not only invest in analytics as well as planning/forecasting systems for their resources based on past usage data, but also develop processes to encourage predictive and proactive maintenance and support - essentially fixing the product/asset before it breaks down. This can reduce, albeit never remove, the allocation of break/fix tasks in the service portfolio and thus greatly diminish the stress and costs on the service ecosystem of continuous emergency dispatch. Then, there's also the benefit of satisfied customers who won't have to wait impatiently for their service technician to arrive while they lose time and money.
Methodology
In March and April 2007, Aberdeen Group and its partner Directions Media captured 185 qualified respondents in a quantitative survey launched to evaluate and report the impact of effective field service scheduling and routing on a company's financial and operational metrics.
Survey respondents among the Directions Media respondent base can be characterized as follows:
Responding to customer requests for faster service response times, as well as the need to enhance field technician productivity, Original Equipment Manufacturers (OEMs) and Independent Service Organizations (ISOs) are looking to develop effective schedule and dispatch processes to achieve these goals. These OEMs and ISOs are also looking to efficiently route their technicians to customer sites, so as to minimize travel and transit times. This comes at a vital time for these organizations. A recent Aberdeen research product, undertaken in partnership with Directions Media and entitled Service on Time, All the Time, found that nearly 21% of all work orders are completed late (18% for the Directions community, denoted in the figures as "DM Respondents") as against promised response times, necessitating corrective action.
 |
Improved processes and support for field service are intended to ensure that the right technician gets to the right place at the right time. This addresses the issue of improving response times to customer requests. But having a technician arrive on time is worthless if he does not have the right parts or equipment to resolve the service issue on the first visit and needs to schedule a follow-up call (perhaps in another two days).
Therefore, Aberdeen's methodology for classifying best in class companies (best in class firms - top 20%, average - middle 50%, laggards - bottom 30%), which is based on a combination of key performance indicators relevant to field service and the improvements affected in these metrics over the last two years, looks not only at productivity metrics but also at those that document first time resolution. The combination of productivity and efficiency metrics positively affects service profits, which is vital to companies searching for alternative sources of income to supplement product-based revenues that are being shredded by the dual assault of globalization and commoditization.
 |
Key strategies undertaken by best in class firms revolve around four pillars that Aberdeen identifies as key to operating service as a strategic profit center: process, organizational support, knowledge management and performance measurement.
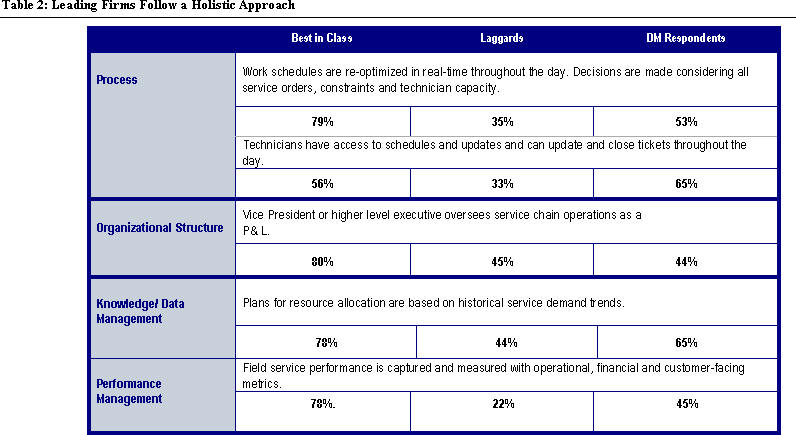 |
Table 2 reveals that leading firms are taking a holistic approach to field service optimization. A notable differentiator between best in class and laggards firms is the existence of a senior-level champion with accountability for service-specific budgeting, forecasting and planning. Senior executives can also play a major role in removing strategic and budgetary roadblocks in decision making, especially when it comes to the addition of support staff or technology to assist post-sales service processes. Evaluation of performance is contingent on the existence of systems and metrics to measure field service productivity and efficiency. It is, therefore, of no surprise that leading firms are significantly more likely than laggards to have these systems in place.
 |
With this as a base, these companies are actively eyeing technology solutions (Table 3) to support their processes. Specific to field service optimization, these firms are four times as likely as laggards to have field scheduling solutions and five times as likely as laggards to leverage route optimization. The tangible benefits of schedule and route optimization solutions range from a 33% increase in customer retention to a substantial 24% reduction in overall service costs (Figure 2).
 |
Leading firms are also actively leveraging location-based services to supercharge their routing solutions. These could range from automatic vehicle location services, to GPS-enabled in-cab mapping for technicians, to location-enabled mapping, which is one of the top inputs that firms consider when assigning field technicians via an optimized scheduling system.
On a final note, it is evident that leading firms are effectively supporting their field service organizations when it comes to the execution of optimized scheduling and routing strategies. But these firms also realize the need to proactively track, monitor and predict field resource needs. Thus, these firms not only invest in analytics as well as planning/forecasting systems for their resources based on past usage data, but also develop processes to encourage predictive and proactive maintenance and support - essentially fixing the product/asset before it breaks down. This can reduce, albeit never remove, the allocation of break/fix tasks in the service portfolio and thus greatly diminish the stress and costs on the service ecosystem of continuous emergency dispatch. Then, there's also the benefit of satisfied customers who won't have to wait impatiently for their service technician to arrive while they lose time and money.
Methodology
In March and April 2007, Aberdeen Group and its partner Directions Media captured 185 qualified respondents in a quantitative survey launched to evaluate and report the impact of effective field service scheduling and routing on a company's financial and operational metrics.
Survey respondents among the Directions Media respondent base can be characterized as follows:
- Job title/function: The research sample included respondents with the following job titles: C-Level (CEO, CFO, CIO, COO, etc), vice president, director, manager, staff, and other. 24% were C-level, 10% were vice presidents or directors, 27% were managers.
- Industry: Responses were received from 26 different industry sub-segments. A sampling of responses includes: Construction - 5%, Hi-Tech - 23%, Manufacturing - 2%, Public Sector - 7%, Telecom - 11%, Transportation - 7%, Utilities - 18%.
- Geography: Responses were received from all geographic areas of the world: 43% from North America, 23% from EMEA, 26% from Asia/Pacific, 8% from South and Central America.
- Company size: 7% from large enterprises (> US$1 billion); 29% from midsize enterprises (revenues between $50 million and $1 billion); and 64% of respondents were from smaller businesses (annual revenues of $50 million or less).
From Our Homepage
Saying Farewell to an Amazing Journey
Communicating with Maps
Is There a GIS Career Ladder?
What does it mean to be geospatially smart? Series
Ways Real Estate and Property Developers Utilize Melissa GeoData for Data-Driven Decisions
Unlocking Value From Daily Satellite Imagery and Insights
Maximizing the Value of Your Address Data with Geo Addressing
How Indoor Mapping Enhances the Security of Smart Buildings
Look Ahead: AI, Location Intelligence and Efficiency
Collaboration Takes on Sea Level Rise & Dynamic Technology Environments
Brownies for Brownfields
Has Everything Been Mapped Already?
How Is Data Literacy Changing in an Artificial Intelligence Landscape
Portfolios for GIS Professionals: More Than Just Maps
How to Create a Distance Matrix in QGIS - A Step-by-Step Guide
7 Ideas for Bringing GIS into the K-12 Classroom
The Geography of Movement