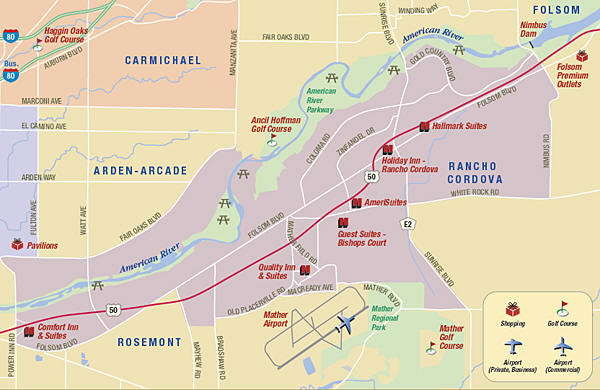
My first article in this series, From
GIS to the Desktop, explored the visual and production value of
taking GIS data and maps to desktop software like Adobe Illustrator.
The visual effects you can elicit in desktop software will make the
trip rewarding - your maps will communicate more effectively, your
clients will be more pleased with the richness of your proofs and
prints, your files will be more portable, and you may discover new ways
of symbolizing map data along the way.
How do you travel from GIS to the desktop, quickly and affordably? This
second article answers that question, reviewing two different routes
from your GIS to Adobe Illustrator.
With one route, you import, edit, project, scale and label your data in your GIS before exporting an Illustrator file that you then edit and complete in Illustrator.This route strips all GIS data attributes and georeferencing from the map once you export it as an Illustrator file. In Illustrator you'll work with graphics, that is, vector points, lines and polygons - but not with georeferencing and attribute data.
With the other route, you import, edit and perform various GIS operations on your data before exporting files in a GIS format that you then import into Illustrator as data.This packs your attributes and georeferencing information in case you need to access or manipulate it using the Avenza MAPublisher plug-ins during final map production.
Pack Your Bags
Travel usually takes plenty of preparation, and the journey from GIS to the desktop is no exception.Key variables to consider are time and flexibility.Exploit the strengths of your hardware and software by deciding which operations are best performed in your GIS and which in Illustrator.One hardware-software configuration may save time by importing or projecting data much faster than another.
Similarly, traveling light (free of GIS data and georeferencing information) may get you to your destination faster.But traveling fully loaded (packed to the gills with full data and georeferencing information) may give you flexibility to perform additional data operations without returning to your GIS.
Either way, there are common steps you should take before "leaving" your GIS.
If you're a light traveler who won't need access to the data or georeferencing information while in Illustrator, then consider performing the common steps above plus two more.
Import Duties
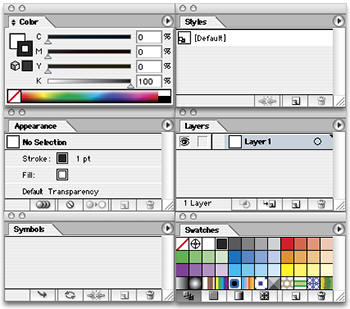
Having left your GIS, you're ready to enter the desktop.Start by opening Illustrator.From the Windows pull-down menu, choose the following palettes to display (they'll be check-marked in the menu if they're already open): Appearance, Colors, Layers, Styles, Swatches, Tools and Type > Character.
If you exported an Illustrator file from your GIS, simply choose File > Open in Illustrator and select the file to open.
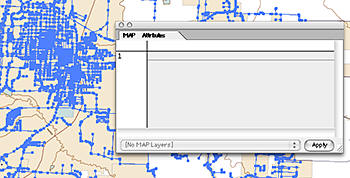
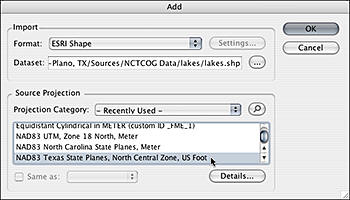
Otherwise, bring your exported GIS files into Illustrator by selecting Avenza MAPublisher's plug-in, File > Import Map Data > Advanced. Use the Add dialog to select multiple files to import, identify the data's projection (if that information is missing from your data files), and select a new or existing "Map View" (a view stores the georeferencing information, such as scale and projection).Each data file is then imported and placed on a separate layer in Illustrator.
Now that it's imported, you can perform operations on your data like these:
Getting Organized
Having arrived at this point by opening an Illustrator file or by building the map from imported GIS data, your next challenge is to organize layers to make your work easier, and to establish the proper visual layering for display and print.
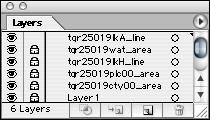
Look in the Layers palette to see if the map's layered data structure was exported from your GIS.If not, you'll need to organize your map by selecting objects and moving them to different layers or to new layers you create.
If the map was exported from your GIS as vector graphics, you can select features and move them to a new layer by dragging in the Layers palette.If your map is built from imported GIS data, and you wish to preserve the georeferencing and GIS attributes, you'll need to use MAPublisher's MAP Copy and Paste Object commands.
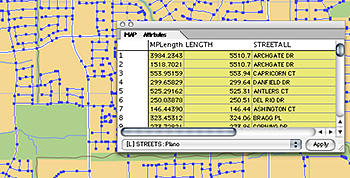
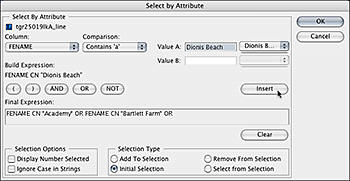
With your data refined, it's a good time to be selective about what goes where.MAPublisher's Effect > MAP Attribute > Select by Attribute command lets you search your data and find all features that meet a criteria you create based on a single attribute.If you have a transportation layer, you can use Select by Attribute to find all street segments matching a type (interstate, federal or state highway, etc.), names, length or any other attribute in your data.You can color-code the selected features or symbolize them, or delete everything on the layer but the features you selected.
Using the Layers palette, you can turn selected layers into "templates," layers which will not export as a proof (PDF, JPEG, etc.) or print.Use templates to store extra or unmodified data for reference or use later or to temporarily hold data from one source so you can compare it with the data from your primary source.
If you need to compare data on two layers, but the topmost of the layers obscures what's underneath it, you can turn down transparency by applying transparency to the layer as a whole.
The Layers palette has another trick in its repertoire that benefits cartographers: it can organize layers as groups within a master layer. Here are two ways to exploit this.
All in all, being organized aids your productivity, making it easier to visualize your data and your developing map, and more efficient as you make changes and edits.It also shapes the graphic or visual relationships of the elements of your map, a necessity when it comes time to print.
Losing Weight
Now that your map is assembled and organized, you're ready to wave Illustrator's filters and live effects wand over your data and turn a frog into a handsome prince.Before you do, though, consider putting your map on a diet.You've already weeded out some extraneous data.Now strip away extraneous vector points from lines and polygons.Use Illustrator's Object > Path > Simplify to perform line simplification on lines and polygons.By enabling the command's Preview, you can judge the effect of your Simplify settings before committing them (and using the Options > Show Original setting, you view the before and after shape or alignment based on the amount of Simplify you've set).On a map with a lot of lines and polygons, the Simplify command can cut your file size down by half a megabyte or more.
Finally, consider putting Illustrator's palettes on a diet.In the palette menus for the Styles, Swatches and Symbols, choose Select All Unused and then choose Delete Symbol.This results in smaller palettes (when you have them open) and lets you find the symbols you create or import later much easier.
Take a Free Trip
We've followed a very general map for getting from your GIS to Adobe Illustrator.Many more commands and functions are available in Illustrator.Give it a try yourself by downloading the tryout version of Adobe Illustrator.
To try out Avenza MAPublisher, download a demo version of the filters.
Consider purchasing or browsing a book about Adobe Illustrator.The Illustrator CS2 Wow! Book, by Sharon Steuer, from Peachpit Press, shows examples of maps that were made from GIS data in Illustrator.
What the Future Holds
My third article will return to the Illustrator special effects we flaunted in the first article.We'll spill the beans on how to achieve many of these effects using some of Illustrator's palettes and commands.
 |
With one route, you import, edit, project, scale and label your data in your GIS before exporting an Illustrator file that you then edit and complete in Illustrator.This route strips all GIS data attributes and georeferencing from the map once you export it as an Illustrator file. In Illustrator you'll work with graphics, that is, vector points, lines and polygons - but not with georeferencing and attribute data.
 |
With the other route, you import, edit and perform various GIS operations on your data before exporting files in a GIS format that you then import into Illustrator as data.This packs your attributes and georeferencing information in case you need to access or manipulate it using the Avenza MAPublisher plug-ins during final map production.
 |
Pack Your Bags
Travel usually takes plenty of preparation, and the journey from GIS to the desktop is no exception.Key variables to consider are time and flexibility.Exploit the strengths of your hardware and software by deciding which operations are best performed in your GIS and which in Illustrator.One hardware-software configuration may save time by importing or projecting data much faster than another.
Similarly, traveling light (free of GIS data and georeferencing information) may get you to your destination faster.But traveling fully loaded (packed to the gills with full data and georeferencing information) may give you flexibility to perform additional data operations without returning to your GIS.
Either way, there are common steps you should take before "leaving" your GIS.
- Compile data from your database or collection of GIS files into just the set you'll need for the map.
- If your GIS is unable to import needed data, plan on importing it later in Illustrator (which means you'll take the route of exporting GIS files instead of an Illustrator file).
- Project your data if it's not already in the final map projection.
- Join lines based on an attribute (for example, join street segments based on a street name attribute).
- Crop your data to the final map area to minimize extraneous data and make the sizes of the Illustrator or GIS files smaller and more easily imported into Illustrator.
If you're a light traveler who won't need access to the data or georeferencing information while in Illustrator, then consider performing the common steps above plus two more.
- Scale your data to the final scale or size you plan for the map (resizing may be easier or more precise if done in your GIS).
- Color data to differentiate map feature classes (you'll need the colors to help you select features later when you work on the map in Illustrator).
- Trim the data in your GIS to cut down on the size of the files that you'll import into Illustrator.
Import Duties
Having left your GIS, you're ready to enter the desktop.Start by opening Illustrator.From the Windows pull-down menu, choose the following palettes to display (they'll be check-marked in the menu if they're already open): Appearance, Colors, Layers, Styles, Swatches, Tools and Type > Character.
 |
If you exported an Illustrator file from your GIS, simply choose File > Open in Illustrator and select the file to open.
Otherwise, bring your exported GIS files into Illustrator by selecting Avenza MAPublisher's plug-in, File > Import Map Data > Advanced. Use the Add dialog to select multiple files to import, identify the data's projection (if that information is missing from your data files), and select a new or existing "Map View" (a view stores the georeferencing information, such as scale and projection).Each data file is then imported and placed on a separate layer in Illustrator.
 |
Now that it's imported, you can perform operations on your data like these:
- Merge layers of similar data (merge data from several city boundary layers into a single layer, to simplify map organization and to speed up operations you'll perform subsequently)
- Delete columns of extraneous data (delete attributes that you won't use to select or symbolize data)
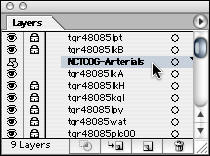
- Add data (import data that your GIS is unable to import or that you discover you need as you progress in building the map)
- Integrate non-GIS vector objects with your GIS data (give non-GIS points, lines and areas georeferencing information so that it can be rescaled or reprojected along with the rest of your GIS data)
- Change projection and scale
- Join lines based on a selected attribute
- Thin lines and polygons by removing unneeded vector points
- Export GIS files (export layers as files that you can archive or that you can manipulate in a database program in your GIS and then re-import into Illustrator).
Getting Organized
Having arrived at this point by opening an Illustrator file or by building the map from imported GIS data, your next challenge is to organize layers to make your work easier, and to establish the proper visual layering for display and print.
Look in the Layers palette to see if the map's layered data structure was exported from your GIS.If not, you'll need to organize your map by selecting objects and moving them to different layers or to new layers you create.
 |
If the map was exported from your GIS as vector graphics, you can select features and move them to a new layer by dragging in the Layers palette.If your map is built from imported GIS data, and you wish to preserve the georeferencing and GIS attributes, you'll need to use MAPublisher's MAP Copy and Paste Object commands.
With your data refined, it's a good time to be selective about what goes where.MAPublisher's Effect > MAP Attribute > Select by Attribute command lets you search your data and find all features that meet a criteria you create based on a single attribute.If you have a transportation layer, you can use Select by Attribute to find all street segments matching a type (interstate, federal or state highway, etc.), names, length or any other attribute in your data.You can color-code the selected features or symbolize them, or delete everything on the layer but the features you selected.
 |
Using the Layers palette, you can turn selected layers into "templates," layers which will not export as a proof (PDF, JPEG, etc.) or print.Use templates to store extra or unmodified data for reference or use later or to temporarily hold data from one source so you can compare it with the data from your primary source.
 |
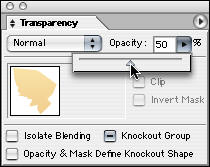
If you need to compare data on two layers, but the topmost of the layers obscures what's underneath it, you can turn down transparency by applying transparency to the layer as a whole.
 |
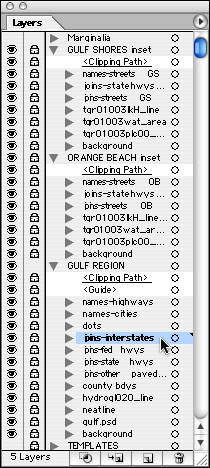
The Layers palette has another trick in its repertoire that benefits cartographers: it can organize layers as groups within a master layer. Here are two ways to exploit this.
- Organize layers thematically; for example, create a Roads master layer and include within it separate layers for interstates, federal highways, state highways, arterials, and so forth. Having your layers grouped this way lets you hide or lock groups of layers while you work on other parts of the map.
- Organize layers by main map and inset, or by multiple maps that you include on a single sheet or page.
 |
All in all, being organized aids your productivity, making it easier to visualize your data and your developing map, and more efficient as you make changes and edits.It also shapes the graphic or visual relationships of the elements of your map, a necessity when it comes time to print.
Losing Weight
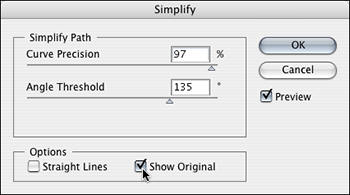
Now that your map is assembled and organized, you're ready to wave Illustrator's filters and live effects wand over your data and turn a frog into a handsome prince.Before you do, though, consider putting your map on a diet.You've already weeded out some extraneous data.Now strip away extraneous vector points from lines and polygons.Use Illustrator's Object > Path > Simplify to perform line simplification on lines and polygons.By enabling the command's Preview, you can judge the effect of your Simplify settings before committing them (and using the Options > Show Original setting, you view the before and after shape or alignment based on the amount of Simplify you've set).On a map with a lot of lines and polygons, the Simplify command can cut your file size down by half a megabyte or more.
 |
Finally, consider putting Illustrator's palettes on a diet.In the palette menus for the Styles, Swatches and Symbols, choose Select All Unused and then choose Delete Symbol.This results in smaller palettes (when you have them open) and lets you find the symbols you create or import later much easier.
Take a Free Trip
We've followed a very general map for getting from your GIS to Adobe Illustrator.Many more commands and functions are available in Illustrator.Give it a try yourself by downloading the tryout version of Adobe Illustrator.
To try out Avenza MAPublisher, download a demo version of the filters.
Consider purchasing or browsing a book about Adobe Illustrator.The Illustrator CS2 Wow! Book, by Sharon Steuer, from Peachpit Press, shows examples of maps that were made from GIS data in Illustrator.
What the Future Holds
My third article will return to the Illustrator special effects we flaunted in the first article.We'll spill the beans on how to achieve many of these effects using some of Illustrator's palettes and commands.
From Our Homepage
Saying Farewell to an Amazing Journey
Communicating with Maps
Is There a GIS Career Ladder?
What does it mean to be geospatially smart? Series
Ways Real Estate and Property Developers Utilize Melissa GeoData for Data-Driven Decisions
Unlocking Value From Daily Satellite Imagery and Insights
Maximizing the Value of Your Address Data with Geo Addressing
How Indoor Mapping Enhances the Security of Smart Buildings
Look Ahead: AI, Location Intelligence and Efficiency
Collaboration Takes on Sea Level Rise & Dynamic Technology Environments
Brownies for Brownfields
Has Everything Been Mapped Already?
How Is Data Literacy Changing in an Artificial Intelligence Landscape
Portfolios for GIS Professionals: More Than Just Maps
How to Create a Distance Matrix in QGIS - A Step-by-Step Guide
7 Ideas for Bringing GIS into the K-12 Classroom
The Geography of Movement