Enterprise knowledge modeling, enterprise GIS and the
new breed of Web-based mapping tools are on a collision course fueled
by demand for a new breed of application. In a sense, this development
is the evolution of the Missing
Department Hal Reid wrote about last year. Reid described a
department that unites a multitude of enterprise data sources - most
importantly business and location intelligence - and extracts
actionable intelligence through the process of predictive modeling and
analysis. This department is responsible for distilling knowledge from
ever-growing volumes of enterprise data in order to provide decision
makers with best-informed operational, competitive and opportunistic
insights. In many cases, this analysis boils down to a risk model that
can adapt to new discoveries and evolving goals. This article takes a
look at a software platform that powers this critical enterprise
function through some real-world application scenarios.
The Elements of Knowledge Modeling
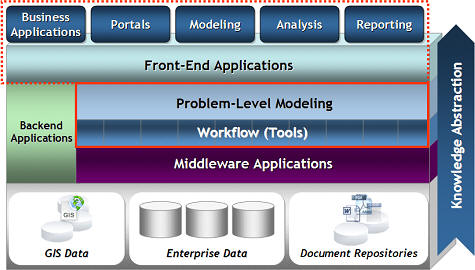
The Thetus Publisher - enterprise-grade knowledge modeling and discovery software - overlays enterprise data layers with a semantically driven conceptual model essential to the analysis and knowledge extraction process. The buzzword is "actionable intelligence," and while this term is common to the intelligence community, it applies broadly to general opportunity and risk modeling , which can provide a competitive edge for any data-rich enterprise.
Standards for data sharing have matured significantly and data gateways that solve data interchange problems are being deployed. Valuable data are beginning to flow across enterprise boundaries with the appropriate levels of governance and policy management. Schema fusion middleware resolves roadblocks associated with cross-database fields and consolidates access points to raw data. However, data alone do not answer the higher-level questions facing decision makers. In fact, massive volumes of raw data could potentially distract from problem-level analysis. An abstraction from the raw data is needed that allows users to quickly access and interact with highly filtered information relevant to their specific objectives.
The Thetus software platform is an example of technology that combines the power of semantics, search, workflow and detailed lineage tracking. The core semantic technology (ontology) underlying the knowledge model is a rich, interconnected network of concepts and relationships that evolves to meet the constantly changing demands of the enterprise. Every aspect of this evolution is tracked - providing comprehensive understanding of the rate and trajectory of change that is so critical to creating accurate predictive models. Completing the platform is an integrated workflow engine to drive automated and on-demand data processing, alerts and notification and a wide array of analytics.
Finding Key Relationships
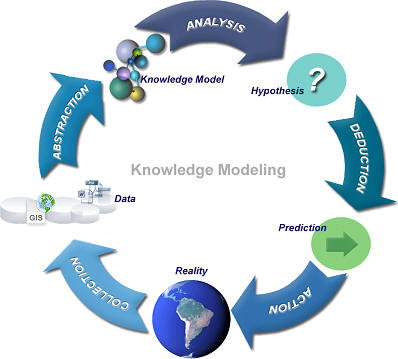
The types of analysis activities required in enterprise, law enforcement and intelligence environments share many similarities. In all cases, the analyst is investigating complex systems and data that cannot be effectively represented by relying solely on traditional schema-based approaches. The general process analysts go through involves collecting data, fusing data, applying various tools and methods for analysis, identifying and evaluating potential outcomes and publishing the results.
Consider an analyst working on risks and impacts for oil platforms. In this example, the system consists of a vast number of interconnected elements ranging from personnel, weather and suppliers to extraction infrastructure and economic models, all of which contribute to risk and cause analysis. Approaching a system of this complexity requires levels of information abstraction to which the analyst can apply processes (analytics, statistics, etc.) and discover or assert relationships among the elements.
Analysts must leverage history, relationships and known facts to identify causes and actions using a combination of inductive, adductive and deductive reasoning. In the past, enterprises have relied heavily on a select set of gurus who, through experience, intuition and analysis, guide operational decision making. However, the complexity and breadth of today’s enterprise systems require a more formalized approach - the "missing department."
Perhaps the best way to understand the knowledge modeling software platform is to examine the types of user interaction it facilitates. In the following example, our analyst is looking for underperforming oil platforms and seeking a clear understanding of the causal relationships among related infrastructure, personnel and suppliers. Walking through a typical workflow scenario illustrates the benefits of this functionality.
Collection, Assembly and Delivery
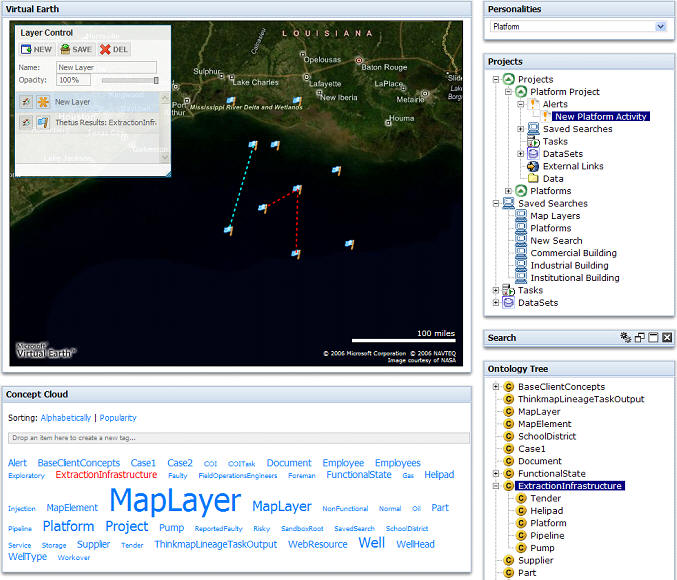
At the beginning of the day the analyst logs into the browser-based Knowledge Portal. An automated workflow task has already assembled targeted information assets and alerts based on the analyst’s function and preferences. In this case the analyst has specified alert criteria based on platform activity, and is notified that there has been new platform activity since the last login. The semantic knowledge model puts the information in context, showing what the related concepts are, where the data came from, how they were derived, and confidence levels for informed evaluation and analysis.
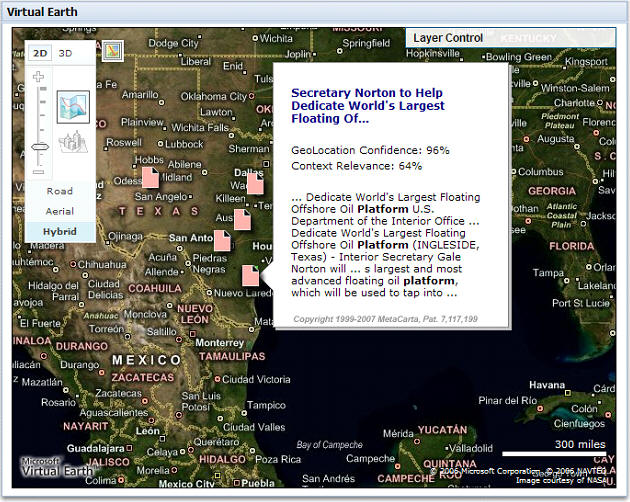
Behind the scenes, the workflow engine is orchestrating the flow of data through a multifunctional analytics pipeline. This pipeline incorporates robust extraction and geotagging capabilities by routing incoming documents and unstructured text through tools such as MetaCarta. MetaCarta software combines powerful search indexing with geotagging, making it possible to extract document meaning and relevance along with geospatial context and filtering. This automated workflow can harness many other applications including image analysis tools and fact extractors, as well as industry-specific analytics.
Fusion and Discovery
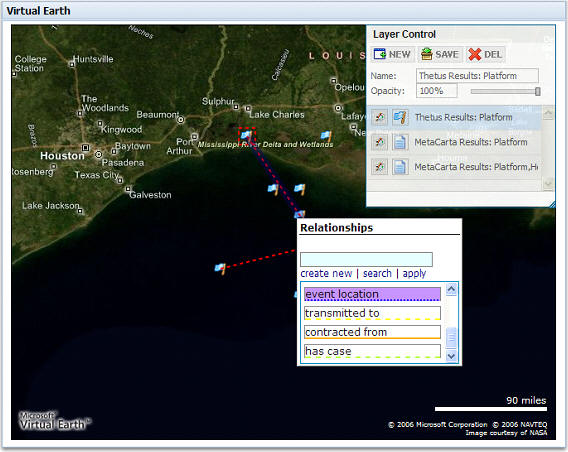
The analyst begins the fusion and discovery phase of analysis by expanding the geographic view and finding related and similar data. Context is critical - the Thetus Knowledge Portal uses a map interface to present data in a spatial and temporal context. The interface puts the power of ontology on the map and the analyst can now see connections and implications that the spatial data alone fail to show. Understanding relationships, patterns, locations and connections is at the heart of risk analysis and predictive modeling. The semantic model enables GIS users to move beyond the limitations of a feature class and express discoveries and relationships by positioning them in the larger problem model.
The portal can incorporate several browser-based map interfaces including Microsoft Virtual Earth or Google Maps. Users requiring a deeper level of GIS support can export information to other applications while maintaining linkages to the knowledge model. This allows the enterprise to use the appropriate level of detail and complexity based on the user audience and function.
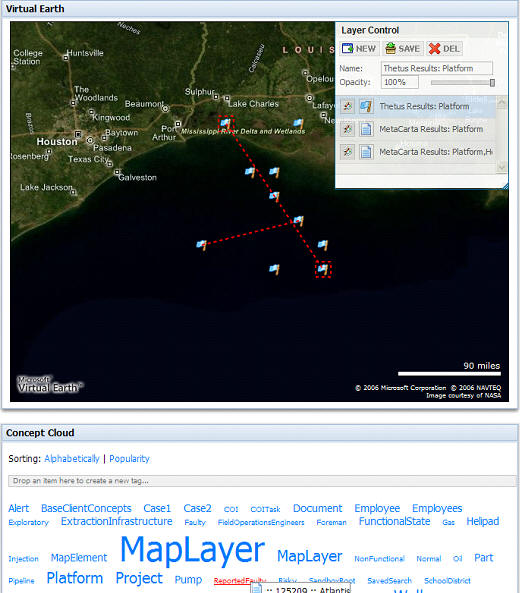
Annotation and Enhancement
As the analyst identifies locations, documents and relationships, he can begin to ‘tag’ any element in the system simply by dragging and dropping it on a concept using an intuitive concept cloud interface. Tagging items positions them in the conceptual structure and enables inference-based searching across the entire knowledge base. This simple function can trigger a complex workflow. For example, reporting and alerting functions can be automatically triggered if the analyst tags a well or platform as underperforming.
Modeling and Hypothesizing
A combined process of proactively pushing relevant data to the analyst using rule-based alerts and notifications allows the analyst to discover related data and assemble a finely tuned set of oil platform characteristics. At this stage the analyst can apply tools and processes to tie together the information and look for a causal component. In many cases the key to identifying risks and causes is in understanding how things are related. The Thetus Publisher includes an inference-enabled search engine to apply the logical structure of the knowledge model to find both explicitly stated and implicitly inferred relationships. For example, there may be relationships between the underperforming well and suppliers several steps removed by subcomponents and contractors. In this case the analyst uses the search related interface where sets of data define the desired end points to find related elements common to the underperforming well. The search related interface reveals that the common element is a specific part supplier. From here the analyst can pose and test hypotheses and prepare to publish findings for review, or recommend a path forward.
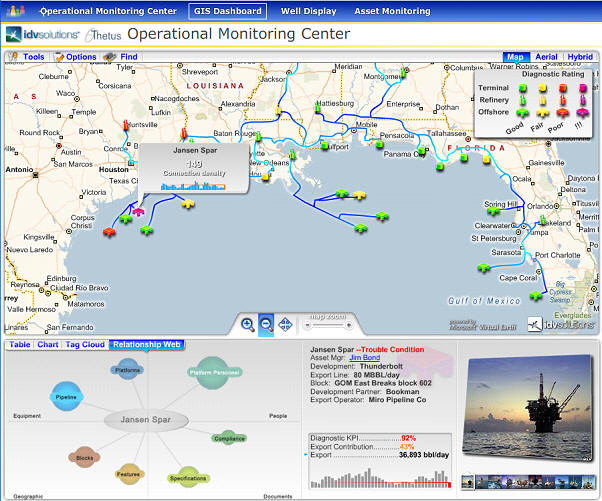
Publishing
The last stage of the analysis process is combining information and conclusions and publishing results. Published information must be presented in a form that is broadly consumable by enterprise decision makers. IDV Solutions provides information dashboards that make sense of dense data and present key facts. When the analyst has finished the analysis, the derived information is presented through the enterprise dashboard interface. The Thetus Publisher provides connections to the supporting information and, if needed, derived conclusions can be tracked all the way back to source data. This tracking is essential for establishing confidence in the data, understanding how decisions are made, and enabling efficient reprocessing of data as the model evolves.
The Elements of Knowledge Modeling
The Thetus Publisher - enterprise-grade knowledge modeling and discovery software - overlays enterprise data layers with a semantically driven conceptual model essential to the analysis and knowledge extraction process. The buzzword is "actionable intelligence," and while this term is common to the intelligence community, it applies broadly to general opportunity and risk modeling , which can provide a competitive edge for any data-rich enterprise.
Standards for data sharing have matured significantly and data gateways that solve data interchange problems are being deployed. Valuable data are beginning to flow across enterprise boundaries with the appropriate levels of governance and policy management. Schema fusion middleware resolves roadblocks associated with cross-database fields and consolidates access points to raw data. However, data alone do not answer the higher-level questions facing decision makers. In fact, massive volumes of raw data could potentially distract from problem-level analysis. An abstraction from the raw data is needed that allows users to quickly access and interact with highly filtered information relevant to their specific objectives.
 |
The Thetus software platform is an example of technology that combines the power of semantics, search, workflow and detailed lineage tracking. The core semantic technology (ontology) underlying the knowledge model is a rich, interconnected network of concepts and relationships that evolves to meet the constantly changing demands of the enterprise. Every aspect of this evolution is tracked - providing comprehensive understanding of the rate and trajectory of change that is so critical to creating accurate predictive models. Completing the platform is an integrated workflow engine to drive automated and on-demand data processing, alerts and notification and a wide array of analytics.
Finding Key Relationships
The types of analysis activities required in enterprise, law enforcement and intelligence environments share many similarities. In all cases, the analyst is investigating complex systems and data that cannot be effectively represented by relying solely on traditional schema-based approaches. The general process analysts go through involves collecting data, fusing data, applying various tools and methods for analysis, identifying and evaluating potential outcomes and publishing the results.
Consider an analyst working on risks and impacts for oil platforms. In this example, the system consists of a vast number of interconnected elements ranging from personnel, weather and suppliers to extraction infrastructure and economic models, all of which contribute to risk and cause analysis. Approaching a system of this complexity requires levels of information abstraction to which the analyst can apply processes (analytics, statistics, etc.) and discover or assert relationships among the elements.
 |
Analysts must leverage history, relationships and known facts to identify causes and actions using a combination of inductive, adductive and deductive reasoning. In the past, enterprises have relied heavily on a select set of gurus who, through experience, intuition and analysis, guide operational decision making. However, the complexity and breadth of today’s enterprise systems require a more formalized approach - the "missing department."
 |
Perhaps the best way to understand the knowledge modeling software platform is to examine the types of user interaction it facilitates. In the following example, our analyst is looking for underperforming oil platforms and seeking a clear understanding of the causal relationships among related infrastructure, personnel and suppliers. Walking through a typical workflow scenario illustrates the benefits of this functionality.
 |
Collection, Assembly and Delivery
At the beginning of the day the analyst logs into the browser-based Knowledge Portal. An automated workflow task has already assembled targeted information assets and alerts based on the analyst’s function and preferences. In this case the analyst has specified alert criteria based on platform activity, and is notified that there has been new platform activity since the last login. The semantic knowledge model puts the information in context, showing what the related concepts are, where the data came from, how they were derived, and confidence levels for informed evaluation and analysis.
Behind the scenes, the workflow engine is orchestrating the flow of data through a multifunctional analytics pipeline. This pipeline incorporates robust extraction and geotagging capabilities by routing incoming documents and unstructured text through tools such as MetaCarta. MetaCarta software combines powerful search indexing with geotagging, making it possible to extract document meaning and relevance along with geospatial context and filtering. This automated workflow can harness many other applications including image analysis tools and fact extractors, as well as industry-specific analytics.
 |
Fusion and Discovery
The analyst begins the fusion and discovery phase of analysis by expanding the geographic view and finding related and similar data. Context is critical - the Thetus Knowledge Portal uses a map interface to present data in a spatial and temporal context. The interface puts the power of ontology on the map and the analyst can now see connections and implications that the spatial data alone fail to show. Understanding relationships, patterns, locations and connections is at the heart of risk analysis and predictive modeling. The semantic model enables GIS users to move beyond the limitations of a feature class and express discoveries and relationships by positioning them in the larger problem model.
The portal can incorporate several browser-based map interfaces including Microsoft Virtual Earth or Google Maps. Users requiring a deeper level of GIS support can export information to other applications while maintaining linkages to the knowledge model. This allows the enterprise to use the appropriate level of detail and complexity based on the user audience and function.
 |
Annotation and Enhancement
As the analyst identifies locations, documents and relationships, he can begin to ‘tag’ any element in the system simply by dragging and dropping it on a concept using an intuitive concept cloud interface. Tagging items positions them in the conceptual structure and enables inference-based searching across the entire knowledge base. This simple function can trigger a complex workflow. For example, reporting and alerting functions can be automatically triggered if the analyst tags a well or platform as underperforming.
 |
Modeling and Hypothesizing
A combined process of proactively pushing relevant data to the analyst using rule-based alerts and notifications allows the analyst to discover related data and assemble a finely tuned set of oil platform characteristics. At this stage the analyst can apply tools and processes to tie together the information and look for a causal component. In many cases the key to identifying risks and causes is in understanding how things are related. The Thetus Publisher includes an inference-enabled search engine to apply the logical structure of the knowledge model to find both explicitly stated and implicitly inferred relationships. For example, there may be relationships between the underperforming well and suppliers several steps removed by subcomponents and contractors. In this case the analyst uses the search related interface where sets of data define the desired end points to find related elements common to the underperforming well. The search related interface reveals that the common element is a specific part supplier. From here the analyst can pose and test hypotheses and prepare to publish findings for review, or recommend a path forward.
Publishing
The last stage of the analysis process is combining information and conclusions and publishing results. Published information must be presented in a form that is broadly consumable by enterprise decision makers. IDV Solutions provides information dashboards that make sense of dense data and present key facts. When the analyst has finished the analysis, the derived information is presented through the enterprise dashboard interface. The Thetus Publisher provides connections to the supporting information and, if needed, derived conclusions can be tracked all the way back to source data. This tracking is essential for establishing confidence in the data, understanding how decisions are made, and enabling efficient reprocessing of data as the model evolves.
 |
From Our Homepage
Saying Farewell to an Amazing Journey
Communicating with Maps
Is There a GIS Career Ladder?
What does it mean to be geospatially smart? Series
Ways Real Estate and Property Developers Utilize Melissa GeoData for Data-Driven Decisions
Unlocking Value From Daily Satellite Imagery and Insights
Maximizing the Value of Your Address Data with Geo Addressing
How Indoor Mapping Enhances the Security of Smart Buildings
Look Ahead: AI, Location Intelligence and Efficiency
Collaboration Takes on Sea Level Rise & Dynamic Technology Environments
Brownies for Brownfields
Has Everything Been Mapped Already?
How Is Data Literacy Changing in an Artificial Intelligence Landscape
Portfolios for GIS Professionals: More Than Just Maps
How to Create a Distance Matrix in QGIS - A Step-by-Step Guide
7 Ideas for Bringing GIS into the K-12 Classroom
The Geography of Movement