 |
Contents
Executive Summary - if you have only 30 seconds
A Visit to San Jose - how one city built its enterprise solution
Intergraph Keynote Addresses - the state of the company and "seamless geospatial computing"
Executive Interviews - making sense of "seamless," the imaging marketplace
Keynote - Thomas Koulopoulos on business in an uncertain world
Sessions - Oracle Locator/Spatial is not scary, education is a growth area
Driving with NAVTEQ - seasick in San Francisco
Seen and Heard - show floor, change is afoot at Intergraph
Executive Summary
Intergraph is updating four key products, but that was not the big story from GeoSpatial World 2005.Instead, it was the updated vision focusing on seamless geospatial computing, a new strategic plan, and a reorganization uniting the four existing divisions to just two.Don't expect huge changes from Intergraph, but rather subtle ones as it moves away from a technology/product focus to a solutions focus, away from self promotion to customer acknowledgment and away from a stodgy business focus to one that serves the greater good.
A Visit to San Jose
As part of GeoSpatial World Intergraph offered three different site tours to explore how users "local" to San Francisco were using its technology.All were "sold out" as of the conference.I joined an internationally heavy group on a trip to San Jose to see the work of its Public Works department in implementing its GIS and how it's changed some aspects of the city.
San Jose will soon be the 10th largest city in the U.S.and is currently known as the capital of Silicon Valley.On the way up in the bus, we saw all the big players' signs as we passed their buildings: eBay, Sun, YesMail...
The move from CAD to GIS has been going on for six years.I met Kevin Briggs, the GIS Manager, when he was two years into the project, when I first attended Geospatial World in Atlanta.Briggs told a story heard again and again: the challenges of determining the cities' needs for data, the challenges of getting money to collect the data, and the challenges of sharing that data.The San Jose experience raised these points which I found most interesting:
• Brigg determined that when he asked his fellow employees about the level of accuracy needed to do their work, they typically replied that what they had now was good.That led him to believe it was his job "to know what they wanted before they knew it."
• Sixteen potential partners came forward to participate in a new orthophotography project.While it would have been nice to include them all at the start, "the challenge of getting 16 lawyers to agree" prompted the city to choose just two other partners for the initial flyover."It's easier to get three lawyers to agree," as Briggs put it.The other partners were brought in after the data was collected.
• California's open records law meant that the city had to be clever about not "letting the data get into the public domain." The city did want the data to be widely used, but once it was in the public domain, there was no way to get the other partners to contribute funds.Some clever licensing from the company that collected the data allowed more fund to be collected.
• LiDAR is the next collection for the city.A first bid came in at $1.2 million for 1' data.A recent update to it offered more detailed data for $700,000.It's clear that technology is undergoing a rapid change.
Briggs colleague, Harsh Gautam explained the technology situation in the city.Again, the story was familiar ("we built an enterprise system on Oracle").These points piqued my interest:
• The city implemented different accuracy standards for data in the enterprise (2') and outside the enterprise (5').
• The city chose to standardize on its conversion tool.It chose FME since exporting from say MapInfo or ESRI or Intergraph products produced "different data."
• Interoperability was "solved" not by standardizing on a software package but by standardizing on a database.Gautam also offered that this methodology might help eliminate the need for translation at some point.
• Gautam plugged two other pieces of software during his overview: ER Mapper's ECW and MapText's labeling tools.
Jim Seymour from the Fire Department detailed "where the rubber met the road," that is, how the updated basemap from the Department of Public Works is now the backbone of the dispatch system.Although the dispatch system is also from Intergraph, the Department of Public Works dumps out the spatial data every two weeks and the Public Safety team uploads them to their database.At one point that process took four days; it now takes four hours.Also of note, each 911 operator has a local copy of that data, making mapping exceptionally speedy.
Intergraph Keynote Addresses
A six person "marching band" opened the session causing some quizzical looks.My thought: perhaps next year we'll be in New Orleans.I suspect these days a technology conference must open with music or a whiz bang video.
 |
Halsey Wise, Intergraph's CEO opened the day noting attendees from 38 states and 56 countries.(Intergraph has users in 39 Departments of Transportation in the U.S., which may help explain the 38 number).He noted that the company is a leading Spatial Information Management company.That term has crept into the company's press releases lately.That confused me a bit as the company tries to highlight the importance of "geospatial" as the term of choice for the industry.Interestingly, an announcement on Wednesday noting the aggregation of the existing four divisions into two introduces a new name for the group which includes what was IMGS: Security, Government & Infrastructure.
Of more importance to Wise are the company's 12 year record values in most measurable statistics."The company is in the best condition in modern times," he noted more than once.He did not suggest when "modern times" began.
He proudly borrowed General Clapper's (of the National Geospatial-Intelligence Agency, NGA) "now, next, after next" idea to share some insight in where the company is going."Now" the company is evaluating what it's good at, and focusing energies there.Interestingly, the company has prepared its first strategic plan in 15 years.(That struck a nerve; several people showed dismayed looks when bringing up that fact later in the week.) "Next," at least with regard to IMGS/SG&I, there will be a shift to vertical SIM applications and work to integrate and take advantage of synergies between work in the four divisions.(He may have been alluding to the reorganization announced later in the week.) "After next" Wise envisions "changes in the industry landscape," company, or market expansion and new opportunities.
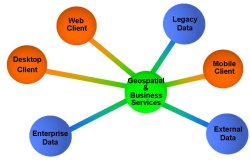 |
IMGS/SG&I President Preetha Pulusani set the updated vision for the division.It's termed "seamless geospatial computing," a concept encompassing seamless data integration, seamless clients (all the various small and large devices and their different operating systems), seamless scalability (Web services are designed to be scalable), and seamless application integration (linking different applications).Apparently "seamless computing" was a hot term used by Microsoft and other vendors some years ago.I confess not to recall the term's use and was at first a bit confused about its introduction into Intergraph's marketspeak.(More on this below)
Pulusani followed up with a laundry list of user successes highlighting data integration, data fusion, application integration, spatially enabling the enterprise, scalability (where the quote from a visionary in Catalan noted he wanted his system to be "useful, usable and used"), mobility and extreme digital production.That last term means not the extreme mapping Bentley highlighted in recent years, but basically the company's DMC and its benefits.
I give Intergraph credit for focusing the time on the users' success.In past years I've felt Intergraph focused too much on itself during the opening session.On the other hand, the quick steps through the examples led to monotony and resulted in a what one (nameless) employee termed a "snoozer."
There were more user stories from Art Spencer, executive vice president.He extolled Progress Energy Florida for its work before, during and after 4 hurricane hits in its territory in 2004 and STA in Rome (which manages transportation) for its work managing the city during the Pope's funeral.
He highlighted some less that remarkable statistics from an Economist Intelligence Survey Unit study in 2005 of 500 worldwide executives.They noted these strategic processes as most desired:
• Lower cost 47%
• Increate customer satisfaction 46%
• Improve performance and processing 36%
But, added, Spencer, there's also the goal of "supporting the greater good." While I know that Intergraph and its customers have been doing such work for the common good for some time, this is one of the first time's I've heard it explicitly mentioned in this sort of forum.It's the sort of message I'm more used to hearing from other companies in this arena.
The bulk of Spencer's time was devoted to a detailed demonstration of solutions for 911, utilities and traffic solutions associated with a single event: a water main break.He concluded by suggesting that Intergraph wants to help its customers address and improve the "chaotic, damaged and leaky" world in addition to adding to the greater good.
 |
Matt Tate, vice president, highlighted work in earth imaging and geointelligence.Earth imaging addresses work from mission planning through data distribution and provides a way to "see the world clearly." That in turn supports the work of geointelligence for the military, intelligence and security operations.Of particular interest were "fusion" examples including one that connected and overlayed video, vector features and line of site information with imagery.Among the partners noted was Skyline, one of the new darlings of the visualization space.
 |
David Holmes, Director of Worldwide Product Strategy, honed in on the importance of service oriented architecture (SOA) and its role in the new "seamless" vision and ran down the new offerings in the division's six product lines.GeoMedia 6, he and others noted, is the most significant release since 1.0 and might be referred to as the "enterprise edition." The biggest change is the ability to save and share parameters for legends, symbology and even interfaces to be shared across the enterprise.(That reminded me very much of work Autodesk did in that arena for AutoCAD some years ago.) Among the list of enhancement was "CAD like editing." Tools like drawing parallel and perpendicular lines will now be part of GeoMedia.While it sounds "normal" to hear ESRI talk about CAD like editing tools, it seems odd from the company behind IGDS, and for some time, MicroStation.Still, the additions do highlight that while the "geospatial interfaces" have advanced, CAD still is the winner when it comes to editing.
G/Technology 9.3, it's promised, will "surpass FRAMME and related MicroStation technologies" for the first time.That's a significant statement since the move from FRAMME (which is built on MicroStation) has been in the works for many years.The other four product updates are changes to TerraServer 2.1, ImageStation, IntelliWhere 5.2 and InService 7.9.
Holmes concluded, retuning to the "seamless" idea, that Intergraph doesn't want you to change your architecture, we want to allow it to "play into IT." That will be done via support of WSDL, SOAP and other interfaces and support for OGC standards.
Executive Interviews
I asked Preetha Pulusani, President of IMGS/IG&S to explain how Intergraph's past focus on being "open" works with the new vision of seamless geospatial computing.They are complementary, she noted, both enhancing the number of choices for the end user and the end user organization.When I asked about the "behind the scenes" enabler, service oriented architecture, she suggested it be best left behind the scenes, end-users "don't really know to know the details.They need to know how it will work for them." That's when the light bulb went off for me: the term open and the notion of service orientated architecture are aimed primarily at the developer community.Seamless computing is what the end-user (and management) will see exposed.I asked about the evolution of Intergraph in general, and IMGS/SG&I in particular, moving from a products to a services organization.Pulusani noted that the company is a "software enabled services organization" and that it simply moved from providing "one-time use" solutions to its current focus on reusable software offerings delivered via a consulting model.
Ignacio Guerrero, Executive Vice President of IMGS, explained more about how services oriented architecture is one part of the seamless geospatial computing.In particular it will enable seamless clients, seamless scalability, and seamless application integration..The one area that it will not really address is seamless data integration.That led me to pose whether putting spatial data into an Oracle database really was an interoperable solution.Guerrero suggested that it solves a local interoperability problem, but really draws on the substantial marketshare of Oracle rather than a broad vision of interoperability.He compared it to how Windows ideally solved interoperability problems.In fact, though, issues between files on Macs and Windows machine continue to exist.He shared one other thought on service oriented architecture that I found interesting.Early solutions for integrating applications (COM, CORBA) relied on very detailed, granular, complex interfaces.That complexity tended to lock them to specific platforms (COM on Windows and CORBA on UNIX).By 1999, when the Web was reasonably mature, standards such as XML emerged and coarser, but simpler interfaces emerged.That's the basis of today's implementation of services oriented architecture.
Terry Keating, Executive Vice President of IMGS and chairman of Z/I Imaging, refuted that my sense that all the funding for imagery was coming from the military by citing the 133 cities program (a civilian one), the growing numbers of states flying statewide datasets, and the work of the Farm Service Agency (FSA) to "double dip" by providing both imagery for agriculture and other pursuits.(The FSA work has been very popular with those who do this sort of capture since that work is done in summer, typically a "down time" or most such companies.) I asked about the mention of Visual Learning Systems (VLS) as a new partner earlier in the day and if the time had come for automated feature extraction and change detection.According to Keating, even before the large stores of images of today were amassed, image analysts were demanded these types of tools, if only to speed up the work done by hand.Keating went so far as to say that VLS may well have "turned the corner" in this technology area.I asked what customers are asking for from the imagery side of IMGS/SG&I and got a bit of a history lesson.It took the USGS 100 years to produce the first set of quad maps.It took the same organization 10 years, with few GPS enabled planes, to capture all of the digital orthoquads, (DOQs) for the U.S.Today an entire state can be flown, the data compiled, sliced, balanced, compressed, and delivered chopped up as needed, in a year.Some emergency capture can be done in literally 1 minute."So what do users want? They want it in an instant." To deliver, Keating explained, Intergraph is working on making more and more processes occur "on the fly." There's no preprocessing; instead the metadata required to perform the complex operations is readily available, along with the horsepower to overlay images on DEMs or merge two images in real time.The company is also trying to link related processes, so instead of five separate tasks, a workflow might require just a push of a single button.
Keynote: The Enterprise Revolution
Remember the teachers in school who seemed to go too fast? You knew you got some of the material but other topics seemed out of reach? That's how I felt after listening to Tom Koulopoulos, president and co-founder, The Delphi Group.His presentation was more about business and technology than geospatial technology, though he wove that in very nicely.How does he know about geospatial technology? He's been working with Intergraph on its technology vision.That made him a great choice as a keynote speaker.
One recurring theme in his fast-paced discussion was the idea that how we (geospatial technology people) see the world does indeed have an impact on how others see it.In time, he suspects, more and more "regular people" will look at the world as we do.His example of his first day of college in an engineering program was quite apropos.The dean noted to the new students that engineers look at chairs as sets of force vectors, not as places to sit.
He highlighted the "value of knowledge" by noting the cost per pound of different physical items.Rolled steel is pennies per pound.A racing bike is $100/lb, a Treo, $1,500/lb, a Hermes scarf $1964/lb.Why is scarf so expensive? All that marketing (that's a type of knowledge, too) costs money! Viagra runs $12,000/lb and a computer chip about $25,000/lb.
What is this value? Where does it come from? In part, Koulopoulos notes, we put value in objects (or services) because they help us counter uncertainty.He suggests, and I agree, that geospatial technology has a definite value in that context.We may not be able to predict the future accurately, but we can respond to it more effectively with geospatial technology giving us greater confidence in an unpredictable world.
We humans don't like uncertainty.We like systems that make sense, ones that we can predict.As an example he described a card game.If one player in poker draws the exact same cards already in the hand of another, there's an immediate visceral reaction: "You are cheating!" Then another suggestion: "The deck is bad." Then another thought: "Oops do I really have those cards?" All of these are in response to trying to reaffirm faith in the known way poker works.
He went on to note that we are in an "innovation deficit." There's too little innovation here in 2005.In fact, despite more funding for study, there are actually fewer new cancer drugs coming out.Why? Koulopoulos offers a very simple answer: There's lot of information and we can't integrate it.As a graphic example he showed a typically cluttered Windows desktop.And that, he pointed out, is a "virtual world." We can't manage a virtual world, how can we manage the real one?
The future of integration of that information lies in the three phases of computing, Koulopoulos suggests.The first is where a series of applications appears on the desktop with no integration.They are just visually on the same screen.By phase 2 they at least adhere to a set of common standards, but are still basically unlinked.In phase three, perhaps 10 years down the road, we will be creating specific "on demand" applications for our own use built from many components distributed across many networks.How will this "on demand" application be enabled? Services oriented architectures.In fact, says Koulopoulos, service oriented architecture is currently a noun.In time it will be a verb.
He provided three very different examples of how "personalization" and "intimacy" are keys to successful computing solutions.First he noted the Newseum.org website.It's a website that provides, among other things, the front pages of many of the world's top newspapers everyday.How? Via a federation allowing the parts to come together technically.SETI@home was the second example.That's a grid computing solution to support the search for extra-terrestrial life by using unused cycles on personal computers.Together, they make up the power of a several supercomputers.So, why do individuals "donate" their cycles? If something is found, and their computer participated, they are part of this scientific endeavor, they become "famous." The final example was Lands End "avatars", online models of shoppers built from their exact measurements.They are used to "try on" stock clothing and to initiate custom made clothing orders.It's rather intimate he noted, providing all that information to the computer.And, it turns out, once a shopper creates an avatar, there's a 70% likelihood, the shopper will "buy clothes" for the avatar, that is, him or herself.
Koulopoulos's final point directly related to Halsey Wise's ideas from the day before.Wise had noted that Intergraph is identifying its strengths and focusing on those areas.Koulopoulos highlighted that there is far less liability/risk/uncertainty when a company concentrates on core competencies and, there is more opportunity for innovation.
I chatted with Koulopoulos after the presentation and asked about the innovation deficit.He sees three ways to innovate: create a new product or service, modify an existing product or service incrementally or (re)position a product or service.The first option is the most difficult and the most infrequent.The third is done all the time.I provided the example of the Hermes scarf.The innovation is positioning it as a "lifestyle" accessory worth top-dollar.Coke and Pepsi "innovate" that way with to sell their soft drinks.But the second option, tweaking products or services incrementally, is the area with the most potential impact and most opportunity.We explored the tiny "tweak" of Google adding satellite imagery to its maps.That was a small thing, which, to many in the geospatial community, was no big deal.To the huge user base of Google Maps it was extraordinary.Those sorts of changes in widely used products and services are the innovations to expect in these times offered Koulopoulos.
Sessions
If you ever want to get straight exactly how GeoMedia works with Oracle Locator and Spatial, look for a session by Chuck Woodbury.He made a potentially scary (and, let's be honest, dull) subject clear and even amusing.I have a small bit of Oracle experience from years ago, but the new implementation in GeoMedia 6 and the growth of Oracle's Locator (in the box) and Spatial (extra add-on) make it seem far easier to set up from scratch than ever before.The one thing Woodbury stressed throughout is that Oracle continues to implement small tweaks to its data model to better serve interoperability challenges between software clients.An industry consortium succeeding in getting "oriented points" into Oracle's list of native spatial objects and cartographic text is expected soon.
The Education Symposium 2005 was a one day track on geospatial education.The opening panel discussion highlighted the state of the art at universities, trade schools, and K-12.The success of the technology in all of these different areas is heartening.So is the creativity of those trying to introduce more students to the technology.One audience member noted that an outreach exercise hosted by his university for high school students involved letting them "play with" Keyhole, then challenging them to think about what's behind it.
The United State Geospatial Intelligence Foundation (USGIF) was on hand to provide an update its Geospatial Intelligence Academy.It's maturing and an announcement is expected soon on its Accreditation Panel.Meanwhile, USGIF has identified 5 emerging (work in progress) objectives:
• The certification program - a mix of classes from four areas (geospatial technology and science, functional areas, communications and analytical methods) that will make up a curriculum aimed at grads, post-grads and adult learners.
• Targeting 7-12 students with the options of a geointelligence carreer
• Teaching of skills to K-6
• Providing a one stop clearinghouse of resources for teachers and students
• Supporting continuing education for those in geointelligence
Driving with NAVTEQ
NAVTEQ offered the opportunity to "Ride Along" as its representatives captured data for San Francisco in their specially equipped car.I joined another editor for a ride up and down San Francisco's hills in the rain.The car houses a powerful GPS (capturing one point per second), a real time video camera mounted in center of the windshield, and an interactive map display screen between the driver and passenger.The company runs its own proprietary software which allows the passenger to drop icons on the appropriate locations (such as speed limit signs) and note which lane the car is in (1 of 3, 3 of 3).Most of the information though is captured by voice.As we drove, the driver called out "662 first address on right, 671 on left," "Post Street, one way right to left," "Geary no turn restrictions" "bailing to lane 1 of 3"...
The NAVTEQ staffers have assigned areas which they drive "a few times a quarter." They noted spending about one third of their time driving and the remainder in the office compiling the data from the software, aerial images, video, maps from the local governments and voice.While multi-tasking like this seemed quite complex to me, after a few months training, new recruits are out on the roads."It takes about a year to really get up to speed," one representative noted.What's the toughest part of the job? "When many small streets come together and there's so much information to be captured in a short time." I am confident this is not a job I'd enjoy; I got a bit seasick just watching.
Seen and Heard
The exhibit floor was rather small (I counted 22 non-Intergraph booths) and some partners were notably absent: LizardTech and Keigan Systems to name two.There were many "empty" spaces between active booths.Exhibitors noted that dedicated hours for the exhibits kept things busy; so did ice cream on Wednesday afternoon.Panasonic was showing off its Toughbooks, while Trimble focused on it new higher resolution data capture devices.Several international partners were on hand including ACE from Slovakia, a consortium of Dutch solution providers, Laser-Scan from the UK and GIS Development based in India.GIS Development has published its second issue of a print publication for the Middle East called GIS Development Middle East.The single data provider on hand was ORBIMAGE.With attendance at about 1,300 and rates to exhibit considered quite reasonable, I'm at a loss to explain the number of exhibitors.
Intergraph is clearly changing, but it's a subtle change.The visible aspects show in how the company presents itself.It's more approachable, less stodgy.A new ad in the program had three long time product manager holding screen shots of their new releases.The company is about solutions, not technology.The focus on seamless computing instead of open standards suggests that shift.So does the fact that there were no feature/function demonstrations of the new products on the main stage.