Though much of the media focus on Hurricane Katrina
tends to center on New Orleans, the city was part of a larger region
devastated by the storm. Numerous smaller communities throughout
Louisiana and Mississippi required emergency response in the aftermath
of Katrina; some still struggle to recover today. GIS was an integral
part of the response phase throughout the Gulf Coast and the lessons
from those involved in this effort should be shared. Many challenges
faced in a disaster are common regardless of geographic or
disaster-specific circumstances.
Such is the case in this comparison between applications of GIS in emergency response in Hancock County, Mississippi and at the State Emergency Operations Center (EOC) in Baton Rouge, Louisiana. This article outlines the two experiences from the perspective of providing spatial decision support through GIS applications in the response phase of Hurricane Katrina. Though one scale is local and more rural and the other, at the state level and more urban, many commonalities can be drawn from these experiences and applied to GIS applications in future disaster events.
Hancock County
In the weeks following Hurricane Katrina, Hancock County tapped NVision Solutions to supply area maps to the influx of federal, state and other relief assistance personnel. The company developed an informal relationship with the Emergency Management Agency (EMA) as they set up a lab in their Emergency Operations Center (EOC). A representative from the GIS Lab attended EOC status meetings each day offering GIS solutions to problems that would arise. The solutions were often not complex, but rather simple paper maps and atlases. The EMA officials learned what GIS software could accomplish and quickly devised potential applications on their own.
Map Production
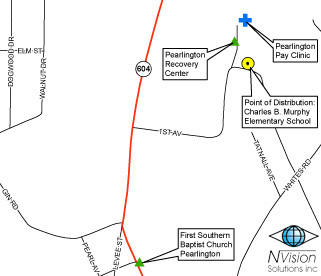
Since Hancock County did not have an established GIS program prior to the storm, many data sets were created, digitized or discovered in the EOC GIS Lab. Many new or relocated facilities such as medical clinics, points of distribution and emergency housing sites were plotted from GPS coordinates (Figure 1). Older roads were updated with digitized line work and modified names. The EMA personnel's thorough knowledge of the county helped with adding appropriate names to the streams data set obtained from the Mississippi Automated Resource Information System (MARIS). Adding stream labels to maps helped EMA officials to better orient themselves in remote parts of the county.
One of the most popular items requested in the GIS Lab was just a basic county map book, which was a bound 58 page tabloid-sized series of maps showing roads and water features in Hancock County. Its compact size was convenient in vehicles where large format maps would be cumbersome. The map book was created using the DS Map Book Developer Sample available for download from the ESRI Developer Network. This free tool divides a map into separate pages based on a grid and creates an accompanying index by street name. This map book was widely used by the groups comprising the EOC, including FEMA, search and rescue (SAR) teams, and fire fighters.
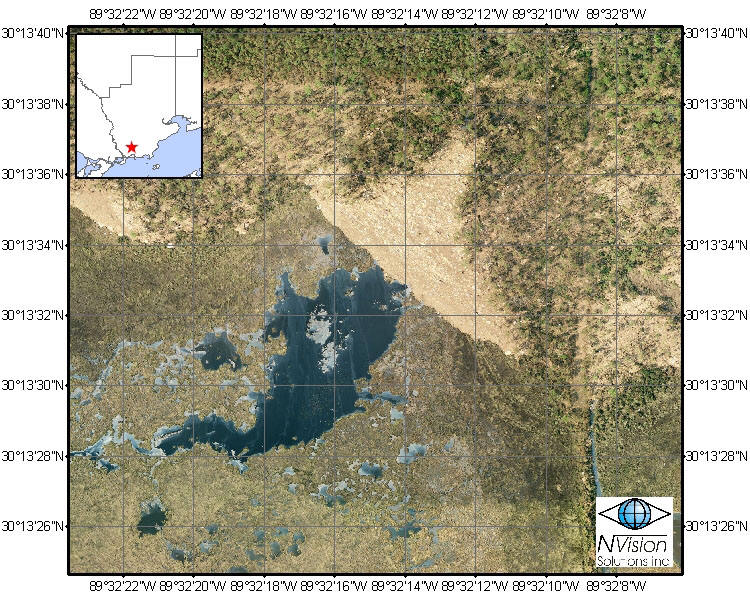
The GIS Lab supported SAR teams with a variety of map products to assist them in their search missions. SAR teams worked diligently to recover missing persons, but bodies were sometimes more difficult to find due to the movement of water. The GIS Lab applied flow direction analyses to show the recession path of Katrina's floodwaters, overlaid with imagery, which helped SAR teams find some of the victims. Before-and-after imagery snapshots and oblique views of specific properties also helped the teams plan safe entry points. Canine search and rescue teams were particularly interested in imagery of the county's 15 debris piles, where flood waters deposited large amounts of debris as they receded (Figure 2).
Operations
The EOC GIS Lab developed a form to expedite the process of tracking and recording map requests. This helped get the right maps out to users, and was a resource to track the kinds of requests received. Fields on the form included map layers desired, size, quantity, requesting organization and justification. The analyst filling the request would pull in the appropriate data layers and quickly apply a pre-staged template including title, scale bar, north arrow, logo and map date. We found that including a map ID or analyst name facilitated quick reprints of custom maps. The lab also preprinted commonly requested maps referred to as "Maps2Go" and posted numbered samples on the wall outside the office. Disaster assistance personnel could quickly retrieve a desired map without waiting for production or printing, saving valuable time. In addition to map production, the GIS Lab provided limited IT support troubleshooting hardware and software in the EOC offices and war room. The Lab also developed a Web-based daily report entry and management system for all emergency support functions housed in the EOC.
Equipment
The EOC was not equipped for GIS prior to Hurricane Katrina. NVision Solutions provided workstations, a plotter, printers and a large format scanner until the county secured four workstations, a server and a plotter through FEMA. The lab also borrowed equipment from agencies and universities in the area, including laptops and printers from Mississippi State University and a laminator from the USGS Mississippi Water Science Center; lamination preserved maps for repeated use in field conditions.
Infrastructure
The EOC and the GIS Lab faced a number of logistical challenges. Frequent outages while on generator power led to lost work and interrupted plots. To minimize these shortfalls, the lab added uninterrupted power supplies (UPS) to all hardware. Even the UPS devices were sometimes destroyed due to rapid successions of power outages.
The EOC was connected to military or FEMA satellite Internets, which were often disconnected due to satellite positions. Upon each restoration, the network required reconfiguration involving a manual reset of the IP addresses for each computer, server or printer. Unreliable Internet in the first weeks following the storm slowed some data discovery efforts. Some data sets arrived at the lab on external hard drives via curriers.
Louisiana
Within days of Katrina's landfall, the limited GIS resources in the state EOC were overwhelmed. At this point, existing relationships between members of the GIS community at Louisiana State University's CADGIS Research Laboratory, in addition to other LSU groups (including LSU's World Health Organization Collaborating Center for Remote Sensing and GIS for Public Health, the LSU Hurricane Center and the Southern Regional Climate Center), and the Governor's Office of Homeland Security and Emergency Preparedness (GOHSEP) were leveraged to bring faculty, staff, graduate students and lab resources into the GIS response. As was the case in Hancock County, the methods and products needed to provide effective decision support were not complex; they consisted primarily of developing atlases and using existing Web resources such as Mapquest.com and Google Earth to facilitate mapping needs (1, 2).
Map Production
An immediate hindrance to effective GIS response at the EOC was the lack of base layers and aerial imagery, making the most urgent requirement a comprehensive and easily accessible data source. As Mississippi turned to MARIS, Louisiana turned to Atlas, the Louisiana Statewide GIS housed in LSU's CADGIS Research Laboratory, to provide all base data.
Once layers and imagery were obtained, map production began. Requests centered on three formats: wall-sized, hand-outs and digital. Large wall maps were needed for group discussions and as background for press conferences, while handouts were used in the field, in meetings and for press material. Digital maps were provided in a variety of sizes and formats.
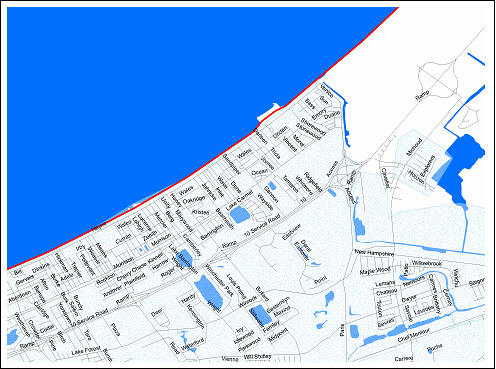
Similar to Hancock County, a road atlas was the most requested map product in the Louisiana EOC. A map book was created for New Orleans, as it was the focus of most search and rescue activities. Paper maps and atlases purchased from local book stores were also used, as many responders were from out-of-state and unfamiliar with how to get from Baton Rouge to New Orleans and surrounding areas. Figure 3 displays one section of the map book created for the State Police. Having it in a GIS format was useful in that FEMA damage assessment data and flood extent and depth could be included to give responders an updated picture of the situation on the ground.
Another typical application of GIS in the EOC was to assist responders in identifying locations in need of search teams and then helping them allocate resources among the locations. For example, the U.S. Public Health Service came to the GIS desk for assistance in assigning teams to various hospitals in the Slidell, Louisiana area. Helicopters were taking several teams into the area and personnel needed to know: 1) where to land the helicopter in order to drop off teams; and 2) which teams should be sent to which places.
The use of GIS in this situation was representative of the way many maps were made in the EOC – not aesthetically pleasing, but functional, as demonstrated in Figure 4. Copies of these maps were printed and the responders used them to draw and make notes about who was going where. At first, GIS personnel found it difficult to suspend their knowledge of cartographic conventions in favor of what came to be known as the "quick and dirty" or "quick and ugly" maps. However, function was the goal and time was of the essence, so maps were made accordingly. In a few cases, though, aesthetics were important, especially when politicians requested maps for press conferences and briefings of high-level officials.
Though the majority of map products were developed for government personnel, some media requests were filled, as were some requests from citizens. In fact, on several occasions personnel at the GIS desk were not only making maps, but also assisting victims in acquiring the appropriate resources for their needs, such as finding missing family members. In addition, when people called into GOHSEP asking if their house had been flooded, these questions were directed to the GIS desk because it had access to Google Earth loaded with a flood mask of the city. Also, with the development of a flood depth grid, GIS personnel were able, on a few occasions, to tell callers not only that their house was flooded, but to what approximate depth. From these conversations with impacted people, it was clear that knowing their house was flooded was better than not knowing anything at all, thus demonstrating the importance of providing the public with geospatial decision support as well.
Operations
In the early days of the operation, many response groups were unfamiliar with GIS and therefore did not make use of this resource. On September 8, we began working with the Port Authority of New York and New Jersey, whose personnel were volunteering in the response. When the volunteers saw the GIS desk, they immediately put this resource to work for them. GIS had played a crucial role for them in the 9/11 response, so they knew what to ask for. Their interest generated attention from most other entities involved in response and from that point forward, the GIS desk was operational on a 24-hour basis every day until the response to Katrina transitioned into recovery. Of course, this was only a brief respite as operations intensified with the landfall of Hurricane Rita in southwest Louisiana.
Equipment
The state EOC was not adequately equipped with GIS and the implements needed for effective response. Indeed, the "GIS desk" was one of many desks in the chaotic EOC. This was certainly not a conducive environment for mapmaking, especially considering that maps were being sent to the same printers and plotters used by every other entity involved in the response, creating a backlog that had repercussions for the map users. This situation was particularly problematic for the time-sensitive needs of SAR teams. To rectify the situation, LSU's WHOCC lab donated two of its laptops and one plotter to the effort. The CADGIS Research Lab also contributed resources to the response. This lab permitted use of any of its 60PCs and 5 plotters for GIS needs. LSU students staffed the lab and were in constant contact with the LSU team in the EOC. Through a tracking system these students handled map requests sent from the EOC and then, through Cicso Systems' VPN Client, were able to post the finished products to the 20TB storage location, at the time named "FEMA-Store" (now named "GIS-Store") for pick-up, printing, and delivery by EOC staff. In cases where EOC printing capacities were overwhelmed, CADGIS staff printed maps and then physically delivered them to the EOC. In light of this experience, GOHSEP has discussed setting up a dedicated GIS lab across the hall from the EOC with all requisite computers, printers, and plotters to be utilized in future response operations.
Infrastructure
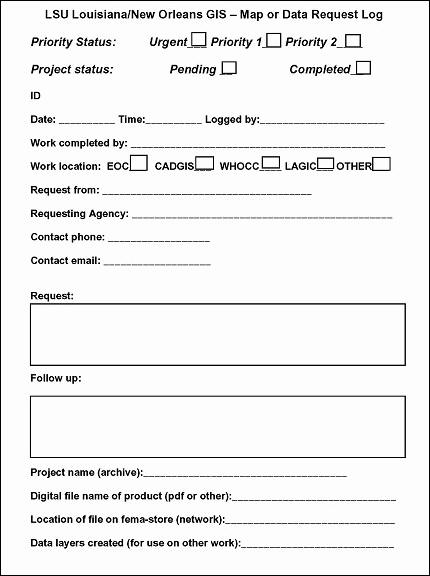
Though power supply was not a problem in Baton Rouge, a number of other issues threatened the effectiveness of GIS response. As has already been mentioned, one of the main problems was availability of equipment and access to data in the EOC. The other primary infrastructure concern was organization. A paper filing system was the initial method of managing requests. This system worked in the early days before the GIS desk was "discovered." After that point, map production continued around the clock with an unending queue of requests. In order to provide a systematic method of processing these requests, the Southern Regional Climate Center (SRCC) at LSU provided access to its project tracking system (Figure 5). GIS volunteers were on rotating shifts and they needed a way to provide continuity to projects. This system has also proven to be a useful archival tool for informing the after-action reports of those involved in the GIS desk and for agencies that used this resource.
Implications for Future GIS Response
In both examples, GIS response was bolstered by the activities of groups outside of the mandated government agencies. Outside assistance is commonplace in disasters of this magnitude. Furthermore, these examples accentuate the benefit of building relationships across the GIS community ahead of the disaster, including public-private partnerships and university-government collaborations. In both of the above examples, GIS served as a language common to the outside organizations, helping them to better understand the area. Furthermore, given the experiences drawn from Katrina and 9/11 (Jack Eichenbaum's 2002 article in Assessment Journal), establishing a "volunteer pool" of GIS responders to call upon in the event of a disaster is a free and simple way to prepare an effective response.
It is also critical for GIS responders to think outside of the software box. As demonstrated in accounts from the Hancock County EOC and the State of Louisiana EOC, many requests require uncomplicated solutions. Traditional GIS software applications are not always the most effective method for achieving situation awareness in disaster response. Using online tools, such as Mapquest.com or Google Earth, can satisfy many requests, especially as vector GIS layers can be converted to KML and viewed in Google Earth. Figure 6 demonstrates one of the tools commonly used in providing situation awareness for decision makers in the EOC, and then later used for public data dissemination. In addition, training non-GIS personnel in the use of these tools greatly reduces reliance on a GIS desk for basic location and direction queries, thus freeing technical resources to be applied toward more complex issues.
Though these examples of GIS response in Hurricane Katrina demonstrate similar experiences, some distinctions also exist based on urban or rural classification and their differing geographies. The two instances represent disparate levels of decision making for different population sizes. Naturally, greater media interest will be drawn to the state level. In urbanized areas, such as New Orleans, there may be a greater need to address post-event environmental health conditions due to higher concentrations of industrial operations or flooded vehicles. For rural areas, some pertinent geospatial data sets may not exist for the impact zone such as adequate pre-event imagery. This is the case in Google Earth (covered in Nature, fee required), where higher resolution imagery is often not available outside larger cities. In both rural and urban areas, identifying critical infrastructure, re-allocating resources, providing for SAR navigation needs, and maintaining general on-the-ground situation awareness will require geospatial solutions. There are more similarities than differences in the implementation of effective GIS response in rural and urban areas. Therefore, knowing what to expect and preparing for these situations in advance of disaster is a clear path to providing an effective GIS response, regardless of location and what the disaster might be.
Such is the case in this comparison between applications of GIS in emergency response in Hancock County, Mississippi and at the State Emergency Operations Center (EOC) in Baton Rouge, Louisiana. This article outlines the two experiences from the perspective of providing spatial decision support through GIS applications in the response phase of Hurricane Katrina. Though one scale is local and more rural and the other, at the state level and more urban, many commonalities can be drawn from these experiences and applied to GIS applications in future disaster events.
Hancock County
In the weeks following Hurricane Katrina, Hancock County tapped NVision Solutions to supply area maps to the influx of federal, state and other relief assistance personnel. The company developed an informal relationship with the Emergency Management Agency (EMA) as they set up a lab in their Emergency Operations Center (EOC). A representative from the GIS Lab attended EOC status meetings each day offering GIS solutions to problems that would arise. The solutions were often not complex, but rather simple paper maps and atlases. The EMA officials learned what GIS software could accomplish and quickly devised potential applications on their own.
Map Production
Since Hancock County did not have an established GIS program prior to the storm, many data sets were created, digitized or discovered in the EOC GIS Lab. Many new or relocated facilities such as medical clinics, points of distribution and emergency housing sites were plotted from GPS coordinates (Figure 1). Older roads were updated with digitized line work and modified names. The EMA personnel's thorough knowledge of the county helped with adding appropriate names to the streams data set obtained from the Mississippi Automated Resource Information System (MARIS). Adding stream labels to maps helped EMA officials to better orient themselves in remote parts of the county.
 |
One of the most popular items requested in the GIS Lab was just a basic county map book, which was a bound 58 page tabloid-sized series of maps showing roads and water features in Hancock County. Its compact size was convenient in vehicles where large format maps would be cumbersome. The map book was created using the DS Map Book Developer Sample available for download from the ESRI Developer Network. This free tool divides a map into separate pages based on a grid and creates an accompanying index by street name. This map book was widely used by the groups comprising the EOC, including FEMA, search and rescue (SAR) teams, and fire fighters.
The GIS Lab supported SAR teams with a variety of map products to assist them in their search missions. SAR teams worked diligently to recover missing persons, but bodies were sometimes more difficult to find due to the movement of water. The GIS Lab applied flow direction analyses to show the recession path of Katrina's floodwaters, overlaid with imagery, which helped SAR teams find some of the victims. Before-and-after imagery snapshots and oblique views of specific properties also helped the teams plan safe entry points. Canine search and rescue teams were particularly interested in imagery of the county's 15 debris piles, where flood waters deposited large amounts of debris as they receded (Figure 2).
 |
Operations
The EOC GIS Lab developed a form to expedite the process of tracking and recording map requests. This helped get the right maps out to users, and was a resource to track the kinds of requests received. Fields on the form included map layers desired, size, quantity, requesting organization and justification. The analyst filling the request would pull in the appropriate data layers and quickly apply a pre-staged template including title, scale bar, north arrow, logo and map date. We found that including a map ID or analyst name facilitated quick reprints of custom maps. The lab also preprinted commonly requested maps referred to as "Maps2Go" and posted numbered samples on the wall outside the office. Disaster assistance personnel could quickly retrieve a desired map without waiting for production or printing, saving valuable time. In addition to map production, the GIS Lab provided limited IT support troubleshooting hardware and software in the EOC offices and war room. The Lab also developed a Web-based daily report entry and management system for all emergency support functions housed in the EOC.
Equipment
The EOC was not equipped for GIS prior to Hurricane Katrina. NVision Solutions provided workstations, a plotter, printers and a large format scanner until the county secured four workstations, a server and a plotter through FEMA. The lab also borrowed equipment from agencies and universities in the area, including laptops and printers from Mississippi State University and a laminator from the USGS Mississippi Water Science Center; lamination preserved maps for repeated use in field conditions.
Infrastructure
The EOC and the GIS Lab faced a number of logistical challenges. Frequent outages while on generator power led to lost work and interrupted plots. To minimize these shortfalls, the lab added uninterrupted power supplies (UPS) to all hardware. Even the UPS devices were sometimes destroyed due to rapid successions of power outages.
The EOC was connected to military or FEMA satellite Internets, which were often disconnected due to satellite positions. Upon each restoration, the network required reconfiguration involving a manual reset of the IP addresses for each computer, server or printer. Unreliable Internet in the first weeks following the storm slowed some data discovery efforts. Some data sets arrived at the lab on external hard drives via curriers.
Louisiana
Within days of Katrina's landfall, the limited GIS resources in the state EOC were overwhelmed. At this point, existing relationships between members of the GIS community at Louisiana State University's CADGIS Research Laboratory, in addition to other LSU groups (including LSU's World Health Organization Collaborating Center for Remote Sensing and GIS for Public Health, the LSU Hurricane Center and the Southern Regional Climate Center), and the Governor's Office of Homeland Security and Emergency Preparedness (GOHSEP) were leveraged to bring faculty, staff, graduate students and lab resources into the GIS response. As was the case in Hancock County, the methods and products needed to provide effective decision support were not complex; they consisted primarily of developing atlases and using existing Web resources such as Mapquest.com and Google Earth to facilitate mapping needs (1, 2).
Map Production
An immediate hindrance to effective GIS response at the EOC was the lack of base layers and aerial imagery, making the most urgent requirement a comprehensive and easily accessible data source. As Mississippi turned to MARIS, Louisiana turned to Atlas, the Louisiana Statewide GIS housed in LSU's CADGIS Research Laboratory, to provide all base data.
Once layers and imagery were obtained, map production began. Requests centered on three formats: wall-sized, hand-outs and digital. Large wall maps were needed for group discussions and as background for press conferences, while handouts were used in the field, in meetings and for press material. Digital maps were provided in a variety of sizes and formats.
Similar to Hancock County, a road atlas was the most requested map product in the Louisiana EOC. A map book was created for New Orleans, as it was the focus of most search and rescue activities. Paper maps and atlases purchased from local book stores were also used, as many responders were from out-of-state and unfamiliar with how to get from Baton Rouge to New Orleans and surrounding areas. Figure 3 displays one section of the map book created for the State Police. Having it in a GIS format was useful in that FEMA damage assessment data and flood extent and depth could be included to give responders an updated picture of the situation on the ground.
 |
Another typical application of GIS in the EOC was to assist responders in identifying locations in need of search teams and then helping them allocate resources among the locations. For example, the U.S. Public Health Service came to the GIS desk for assistance in assigning teams to various hospitals in the Slidell, Louisiana area. Helicopters were taking several teams into the area and personnel needed to know: 1) where to land the helicopter in order to drop off teams; and 2) which teams should be sent to which places.
The use of GIS in this situation was representative of the way many maps were made in the EOC – not aesthetically pleasing, but functional, as demonstrated in Figure 4. Copies of these maps were printed and the responders used them to draw and make notes about who was going where. At first, GIS personnel found it difficult to suspend their knowledge of cartographic conventions in favor of what came to be known as the "quick and dirty" or "quick and ugly" maps. However, function was the goal and time was of the essence, so maps were made accordingly. In a few cases, though, aesthetics were important, especially when politicians requested maps for press conferences and briefings of high-level officials.
 |
Though the majority of map products were developed for government personnel, some media requests were filled, as were some requests from citizens. In fact, on several occasions personnel at the GIS desk were not only making maps, but also assisting victims in acquiring the appropriate resources for their needs, such as finding missing family members. In addition, when people called into GOHSEP asking if their house had been flooded, these questions were directed to the GIS desk because it had access to Google Earth loaded with a flood mask of the city. Also, with the development of a flood depth grid, GIS personnel were able, on a few occasions, to tell callers not only that their house was flooded, but to what approximate depth. From these conversations with impacted people, it was clear that knowing their house was flooded was better than not knowing anything at all, thus demonstrating the importance of providing the public with geospatial decision support as well.
Operations
In the early days of the operation, many response groups were unfamiliar with GIS and therefore did not make use of this resource. On September 8, we began working with the Port Authority of New York and New Jersey, whose personnel were volunteering in the response. When the volunteers saw the GIS desk, they immediately put this resource to work for them. GIS had played a crucial role for them in the 9/11 response, so they knew what to ask for. Their interest generated attention from most other entities involved in response and from that point forward, the GIS desk was operational on a 24-hour basis every day until the response to Katrina transitioned into recovery. Of course, this was only a brief respite as operations intensified with the landfall of Hurricane Rita in southwest Louisiana.
Equipment
The state EOC was not adequately equipped with GIS and the implements needed for effective response. Indeed, the "GIS desk" was one of many desks in the chaotic EOC. This was certainly not a conducive environment for mapmaking, especially considering that maps were being sent to the same printers and plotters used by every other entity involved in the response, creating a backlog that had repercussions for the map users. This situation was particularly problematic for the time-sensitive needs of SAR teams. To rectify the situation, LSU's WHOCC lab donated two of its laptops and one plotter to the effort. The CADGIS Research Lab also contributed resources to the response. This lab permitted use of any of its 60PCs and 5 plotters for GIS needs. LSU students staffed the lab and were in constant contact with the LSU team in the EOC. Through a tracking system these students handled map requests sent from the EOC and then, through Cicso Systems' VPN Client, were able to post the finished products to the 20TB storage location, at the time named "FEMA-Store" (now named "GIS-Store") for pick-up, printing, and delivery by EOC staff. In cases where EOC printing capacities were overwhelmed, CADGIS staff printed maps and then physically delivered them to the EOC. In light of this experience, GOHSEP has discussed setting up a dedicated GIS lab across the hall from the EOC with all requisite computers, printers, and plotters to be utilized in future response operations.
Infrastructure
Though power supply was not a problem in Baton Rouge, a number of other issues threatened the effectiveness of GIS response. As has already been mentioned, one of the main problems was availability of equipment and access to data in the EOC. The other primary infrastructure concern was organization. A paper filing system was the initial method of managing requests. This system worked in the early days before the GIS desk was "discovered." After that point, map production continued around the clock with an unending queue of requests. In order to provide a systematic method of processing these requests, the Southern Regional Climate Center (SRCC) at LSU provided access to its project tracking system (Figure 5). GIS volunteers were on rotating shifts and they needed a way to provide continuity to projects. This system has also proven to be a useful archival tool for informing the after-action reports of those involved in the GIS desk and for agencies that used this resource.
 |
Implications for Future GIS Response
In both examples, GIS response was bolstered by the activities of groups outside of the mandated government agencies. Outside assistance is commonplace in disasters of this magnitude. Furthermore, these examples accentuate the benefit of building relationships across the GIS community ahead of the disaster, including public-private partnerships and university-government collaborations. In both of the above examples, GIS served as a language common to the outside organizations, helping them to better understand the area. Furthermore, given the experiences drawn from Katrina and 9/11 (Jack Eichenbaum's 2002 article in Assessment Journal), establishing a "volunteer pool" of GIS responders to call upon in the event of a disaster is a free and simple way to prepare an effective response.
It is also critical for GIS responders to think outside of the software box. As demonstrated in accounts from the Hancock County EOC and the State of Louisiana EOC, many requests require uncomplicated solutions. Traditional GIS software applications are not always the most effective method for achieving situation awareness in disaster response. Using online tools, such as Mapquest.com or Google Earth, can satisfy many requests, especially as vector GIS layers can be converted to KML and viewed in Google Earth. Figure 6 demonstrates one of the tools commonly used in providing situation awareness for decision makers in the EOC, and then later used for public data dissemination. In addition, training non-GIS personnel in the use of these tools greatly reduces reliance on a GIS desk for basic location and direction queries, thus freeing technical resources to be applied toward more complex issues.
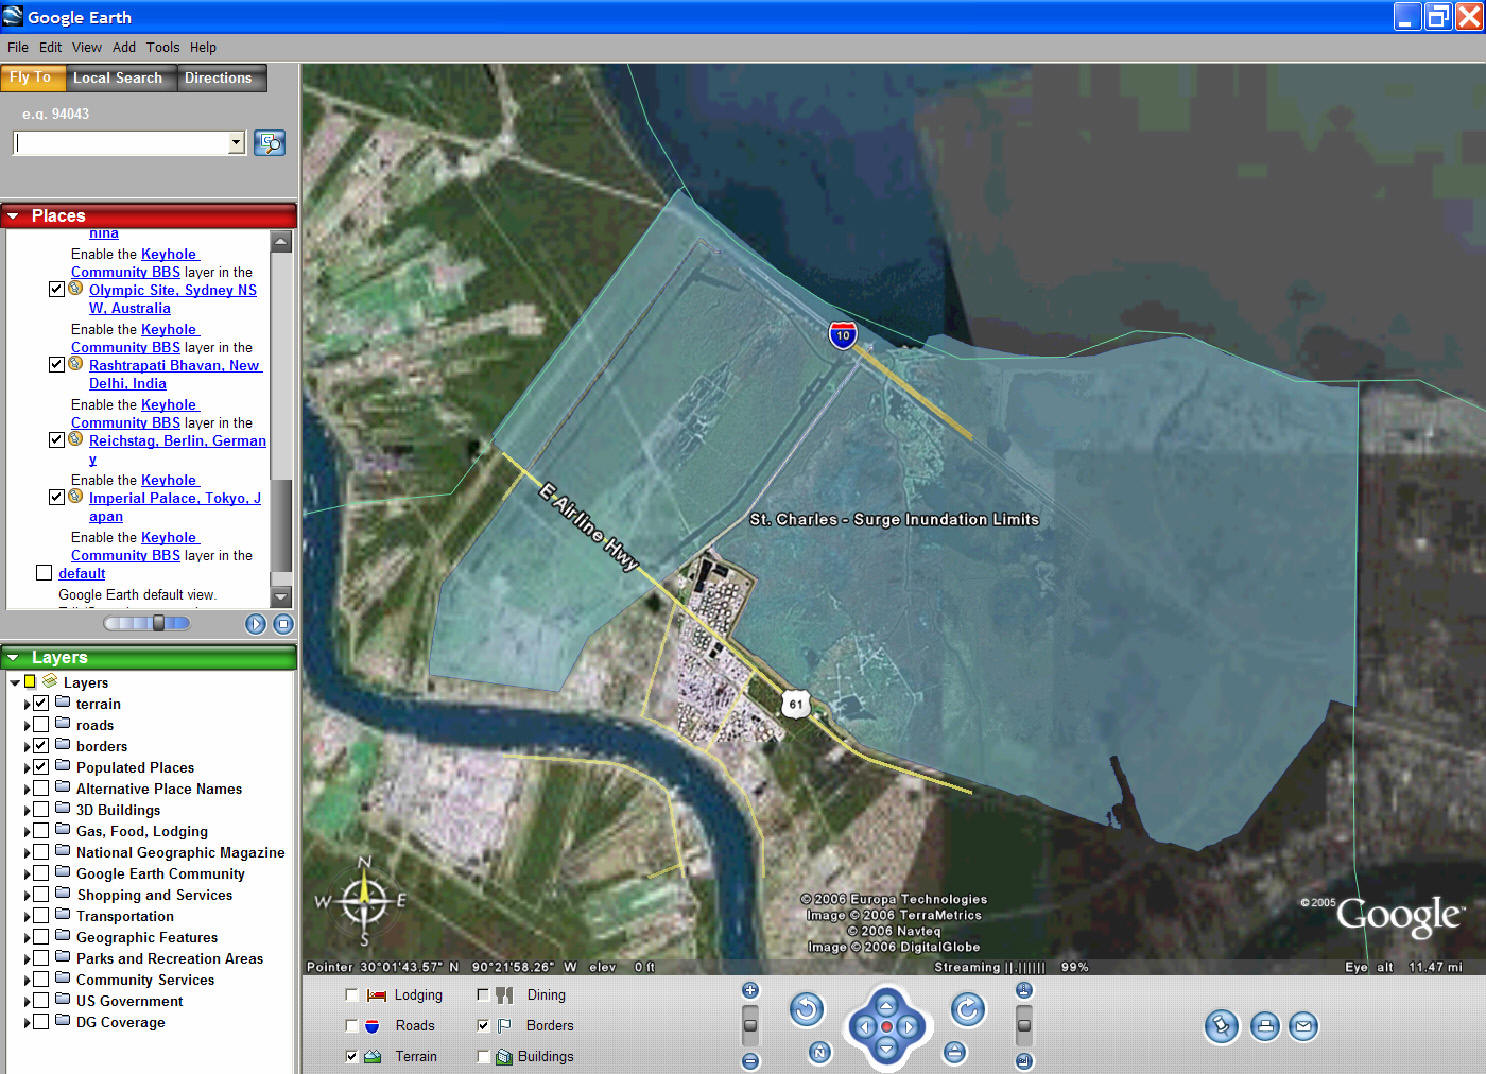 |
Though these examples of GIS response in Hurricane Katrina demonstrate similar experiences, some distinctions also exist based on urban or rural classification and their differing geographies. The two instances represent disparate levels of decision making for different population sizes. Naturally, greater media interest will be drawn to the state level. In urbanized areas, such as New Orleans, there may be a greater need to address post-event environmental health conditions due to higher concentrations of industrial operations or flooded vehicles. For rural areas, some pertinent geospatial data sets may not exist for the impact zone such as adequate pre-event imagery. This is the case in Google Earth (covered in Nature, fee required), where higher resolution imagery is often not available outside larger cities. In both rural and urban areas, identifying critical infrastructure, re-allocating resources, providing for SAR navigation needs, and maintaining general on-the-ground situation awareness will require geospatial solutions. There are more similarities than differences in the implementation of effective GIS response in rural and urban areas. Therefore, knowing what to expect and preparing for these situations in advance of disaster is a clear path to providing an effective GIS response, regardless of location and what the disaster might be.
From Our Homepage
Saying Farewell to an Amazing Journey
Communicating with Maps
Is There a GIS Career Ladder?
What does it mean to be geospatially smart? Series
Ways Real Estate and Property Developers Utilize Melissa GeoData for Data-Driven Decisions
Unlocking Value From Daily Satellite Imagery and Insights
Maximizing the Value of Your Address Data with Geo Addressing
How Indoor Mapping Enhances the Security of Smart Buildings
Look Ahead: AI, Location Intelligence and Efficiency
Collaboration Takes on Sea Level Rise & Dynamic Technology Environments
Brownies for Brownfields
Has Everything Been Mapped Already?
How Is Data Literacy Changing in an Artificial Intelligence Landscape
Portfolios for GIS Professionals: More Than Just Maps
How to Create a Distance Matrix in QGIS - A Step-by-Step Guide
7 Ideas for Bringing GIS into the K-12 Classroom
The Geography of Movement