Enhanced components reflected in SDA 2.0 further advanced Airborne Express' ability to manage and improve route structures.Utilizing the existing SDA architecture and interface and adding more powerful functions, the enhanced version takes route planning to a much deeper level by allowing stations to look at route overlays, structures, street indices, and locate station warehouses based on stop distributions.These functions were added to improve Airborne's ability to analyze routes.Routes were identified as being a high cost savings area during a time of negative company profitability.Automation of mapping routines reduced the time to analyze all routes in a station. This automated means of creating standard methods of analyzing routes was needed to help company initiatives to reduce and restructure routes.This new application has the added ability to be "loosely coupled" with ESRI's ArcGIS, so more robust GIS capabilities are available.
There were three added functionalities
in SDA 2.0:
1.creation of "typical
route" area traces;
2.creation of street indices
to list a route's geography; and
3.identification of stop
weighted centers to improve station location decisions.
Once again, this development effort was jointly made between Airborne Express and Integral GIS, Inc.
"Typical Route" Area Trace
Routes are designed around addresses or stops with frequent activity.Some businesses have packages delivered to them everyday.Other addresses only receive packages once in a while.It is these more frequented addresses that traditionally determine a route layout.The typical route component of SDA 2.0 was designed to provide engineers and station managers with a way of visualizing each route's stops from most to least frequent.Furthermore, if you take a one day snapshot of a route it may not be a typical snapshot of how the route looks.Routes can be planned much more effectively when taking a one or two month snapshot and filtering out the least frequent stops during that time period.This provides a much better sample of how a route should be laid out.The challenge is to find a balance where the core of the route includes the most frequent stops while also including those less frequented addresses. All geographic areas have to be covered by a route so the zone for each contiguous route is considered relative to others.
The typical route area trace component provides an improved snapshot of a route over longer time periods. The software outputs spreadsheet data and maps of the most frequent stops for those routes based on a month's worth of data.Each route has stops that a driver visits frequently while other stops are frequented less often. This basic business rule dictates cost and thus "profitability" of certain routes.It is efficient to run routes in a routine fashion with packages going to the same addresses each day.When an untypical address is visited it cuts into route productivity.The driver has to "break route" and travel to addresses that aren't in the daily routine.There really is no way around this though.However, route planning should be focused on the most frequent stops because they represent the highest cost associated with a route's stops.Efficiently planning around these frequent stops lowers the cost structure of each route.
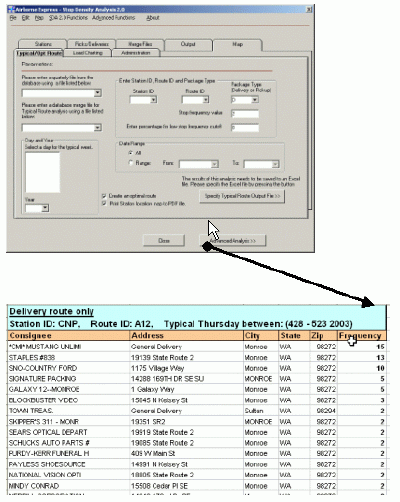
Frequency count of addresses
over a month for a route as processed by SDA.
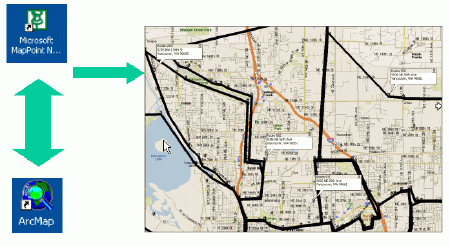
The typical route functionality uses the SDA interface, data access functionality with MapPoint, Access and Excel to create tables of frequency data and latitude and longitude coordinates of each address so they can be imported into ESRI's ArcGIS. ArcGIS provides geospatial capabilities not available in MapPoint.These functionalities make it possible to perform spatial processes and create visually pleasing maps.Geocoding and extraction of coordinates provides the most obvious reason to include MapPoint in this business function. MapPoint's geocoding has been shown to be very accurate and efficient especially considering the software's low cost.
Once the table is imported into ArcGIS, points are categorized into routes using the symbology pallet. Each point that best represents a route's boundary is selected until all points for a given route have been highlighted.MapPoint then connects the points to create boundaries.Once the data is in that environment, station management manipulates each route's boundary to best represent the ideal route area trace.The boundaries are moved around in a push/pull fashion to create contiguous "equal load" routes.This process is based on a dialog between managers, supervisors and engineers that was not previously possible.Simple "what-ifs" are feasible by clicking and moving route boundaries and visualizing how it impacts those routes around them.Looking at the numbers of stops or packages that fall within these boundaries is also possible to best organize the route areas.
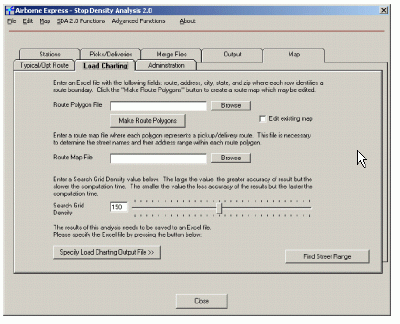
Station managers and
engineers move each route's boundaries to ensure accurate street indices
output.
In order to be effective a route planning tool must utilize local knowledge of routes.This is only possible when the tool and work flow processes use station supervisors and drivers.To effectively design routes, local knowledge of bridges, high rises, traffic congestion and other unique characteristics is required. If they are going to be used by their drivers, the station has to be involved in defining the route area traces.User adoption and low cost were early drivers behind this project.In order to meet these goals, the solution we came up with was to use networking software to conference between the station supervisors, engineers and the corporate PC running SDA.This straightforward solution kept the project under budget while limiting corporate IT resources and provided a solution that met existing station work flow for defining route boundaries.
Creating Street Indices by Route
Each driver is responsible for sorting packages onto his or her truck.Drivers read each address and pull those they should deliver as the packages move down a conveyor belt. It sometimes poses a challenge to get the right packages onto the right trucks.This is especially true with those drivers that fill in on routes they aren't familiar with.To help in this route education process, Airborne turned to desktop mapping and GIS functionality.This component was part of the second SDA development effort and is used in conjunction with the "typical route" area trace.
SDA interface for creating
a station's street indices from previously defined route boundaries.
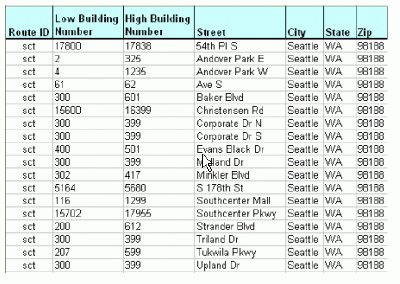
After utilizing local knowledge of a station by allowing supervisors and drivers to manipulate route boundaries and visualize how each route impacts those around them, the software creates a list of street address ranges.The spreadsheet has each route for the station and lists all the addresses and streets by range.For example, Route 100 might include 100-500 Main Street, 200-1000 1st Ave, 100-400 2nd Ave, or some other combination of building addresses and streets.The list is then provided to each driver and used to better familiarize them with the routes so the correct packages end up on the right trucks during the morning sort.Providing street ranges greatly improves route education and aids in transmitting knowledge about route restructures.It has been used for morning sort planning, fill in and temporary drivers and for educating drivers after changing route areas due to major restructuring.
Previous to developing SDA, a street index was created using street files and MS Access.However, this process had yet to apply true geospatial relationships between route boundaries and street addresses.The relationship between street areas and routes was made using look up tables that were maintained at the station.This process was fraught with errors so we created a method that identifies streets based on their location within a route boundary.Furthermore, exporting of street files from ArcGIS and importing them into Access was a time consuming process. Airborne needed an automated method of creating these street range files and SDA and MapPoint accomplished this.This business requirement pushed the software the furthest.
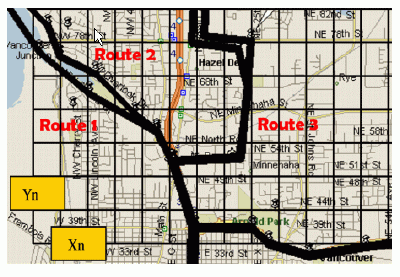
Pixel grid concept for
extracting addresses within route boundaries.
The method for obtaining addresses and address ranges for a given polygonal area was to create a matrix overlay (pixel grid), determining whether a map pixel falls inside or outside a route boundary.If the map pixel falls within the route polygon then the resulting addresses at that pixel location are collected and stored in a data table.The matrix overlay is traversed from left to right from top to bottom.The resulting list of addresses are collected and grouped according to street name.Each grouping is then summarized from low to high address.These building ranges are then written into a permanent Excel file.The output looks like this.
Street index output lists
building and street ranges used by drivers to sort packages.
The user is able to control the number of addresses retrieved and the precision by which those addresses are retrieved by varying a grid spacing value from small to large.The larger the grid spacing value, the higher the precision of the output addresses. The larger grid spacing results in more pixels in the matrix.The more pixels there are the smaller the size.However, with high precision comes much a higher computation time and processing power.A trade off is made depending on the density of the geographic area inside the station boundary. The higher the density, the more precision is needed because there are more routes within this smaller area.
The route trace and street index functions greatly improve Airborne's ability to plan routes and engineer the morning sort.However, this functionality posed the greatest challenge for developing in MapPoint.MapPoint had to be coaxed into behaving as if a topological relationship existed.The matrix overlay (pixel grid) framework provided the programmatic solution.By overlaying a grid onto the building numbers and streets inside each route boundary then the underlying addresses could be extracted from the streets file and exported into Access according to which route trace they were located in.
Station Location Decisions Using Weighted Centroids
The main factor in deciding where to physically locate station warehouses is the point distribution of delivery stops within the station's area trace (boundary).Most of the costs associated with a delivery stop revolve around the transport of each package from the station's sort facility (warehouse) to the delivery address. To limit aggregate travel time and distance (and thus cost), stations are located somewhat equidistant to the average location of the deliveries. This poses a fairly straightforward model for locating stations.
Prior to developing SDA, Airborne used fairly sophisticated modeling software to aid decisions on where to locate stations.However, each analysis typically required two weeks to perform.This lag bogged down production of other maps and created an administrative challenge.In order to streamline location decisions to react quickly to requests we again turned to the SDA architecture.
The weighted centroid component of SDA provides a point and click solution for generating average coordinates for thousands of driver stops over a long time period.Patterns of stops vary based on day, week and month, thus SDA uses multiple month's worth of data that is more representative of a route's typical spatial pattern. The output is sent to a spreadsheet so that zip code clusters can be moved around in case stations are being restructured.This allows for "what if" scenarios for reorganizing stations.Eliminating stations is also supported by taking the zip codes for two stations and having SDA calculate the weighted center of a new theoretic station.In this example, two station warehouses would be closed and a new centrally located warehouse would be opened. This new warehouse would support both of the previous station's areas.
SDA uses MapPoint to create lat/lon coordinates of each delivery and/or pick up during a user defined time period. These coordinates are pushed into a spreadsheet with each row representing a stop for that time frame.The coordinates are then weighted according to how many delivery occurrences took place.The result is a file of average coordinates of all deliveries during the time frame. This file is then imported into ArcGIS where it is added as an event theme and displayed by centroid point.This can be done for one or more contiguous stations to support different types of decisions.Three primary decisions are made based on these weighted centroid maps:
1) single station location;
2) multi station consolidation;
and
3) zip code cluster reallocation
(clusters moved from one station to another).
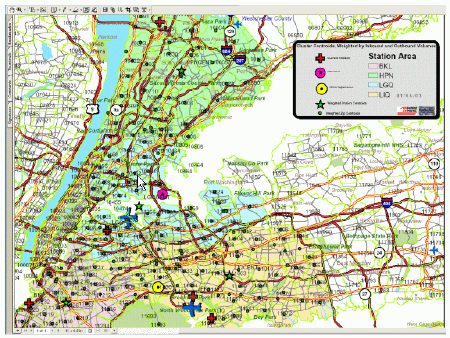
Weighted centroids are
used to analyze station distributions and support location decisions.
The combination of the weighted centroid component and ArcGIS provides a much improved tool to help with station location decisions.Previous to its use, high cost network modeling software was needed.Data inputs for the modeling were extremely detailed and output was difficult to interpret.Warehouse location decisions are multiple party decisions so a simpler approach was devised.Airborne came up with this new methodology and Integral automated the analysis process. After developing the automated approach, these analyses were much quicker to complete.Loosely coupling the SDA with ArcGIS allows for creating maps that best display the information that is needed.
Summary of SDA Accomplishments
SDA represents the first effort by Airborne Express to automate route level mapping and GIS routines that were previously overly time consuming to perform.Considering there are 450 stations and many of these stations have 50 or more routes, the labor costs to support the analysis of routes on a corporate wide basis is staggering.An automated means of producing files was necessary for route level support.
The SDA produces productivity data in the Independent Contractor and Company owned station environment that was not previously possible.This allowed Airborne to proactively plan routes and negotiate contracts on a more even playing field.The simple act of showing a driver a map of their route can significantly raise productivity because they then realize they are being tracked.This alone can impact the driver productivity.The SDA helped Airborne achieve the highest productivity numbers to date as the tool supported Company wide initiatives to reduce costs associated with routes.The software helped increase overall route stop density thus reducing the cost of delivering packages by making each stop more profitable.
Future Development Efforts
The SDA was Airborne's first attempt at using GIS to help increase route level productivity on a Company wide scale.The project was envisioned as a testing ground to see if these types of functionalities could be developed and used.The next phase for this tool is to migrate the business functions to the .NET distributed environment to take advantage of advances in programming using the Internet. One disadvantage of the SDA was the desktop nature of the software.Drawbacks include only being able to perform one or two analyses at a time, the time lag between ordering and receiving an analysis, and costs of distributing outputs to the end user.These drawbacks would be eliminated using a centrally maintained application that is distributed over the Web.Furthermore, this environment would introduce advantages of scalability and capabilities such as wireless and GPS tracking, route optimization, route directions messaging, and other cost cutting and customer service driven functions. Microsoft's Location Server could also be used in this environment in order to use the advantages of that service.
The possibilities are truly
endless as GIS-T continues adding more sophisticated tools and integrating
related technologies including the Internet, GPS, wireless technologies,
and data services such as traffic alerts and construction delay information.
In this way, GIS-T has numerous enterprise wide advantages and should continue
making inroads in the package delivery industry.If these technologies
continue being adopted while further advances are made, the vision of a
centralized "war room" planning of each day's operation might not be that
far off.