Back in the late 1990s one goal of every small town, county, state and country was some sort of Web mapping solution that would be accessible to its constituency. New sites were trumpeted with press releases and after a while, at least I, as an industry watcher, simply stopped exploring the new entries. The sites were becoming commonplace and often very similar.
In 2006, we live several steps beyond the early generations of Web mapping. We are in the age of AJAX and Web 2.0, Flex and more. It's perhaps time to take a look at the latest crop of government mapping websites. What are the new innovations? What works?
To find out, I used a simple tool - Google News - to find the latest announcements of new mapping websites from different levels of government. I explored a few and here's what I found.
There's been a good deal of coverage (1, 2) of the IndianaMap site which offers recent imagery and basic vector data. It's hosted by Indiana University and the Indiana Geological Survey and is managed by the Indiana Geographic Information Council, a nonprofit organization in the field of geographic information systems.
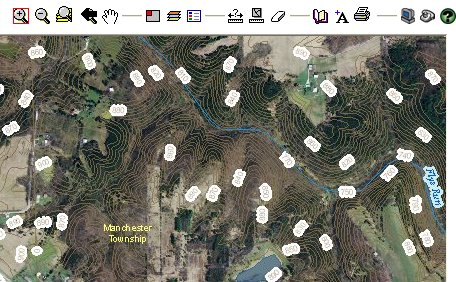 |
The map has its own viewer tied to a backend ArcIMS site. The measuring tools and the ability to save a map, complete with markup, are nice features. Site categories organize the data into folders: aerial imagery, boundaries, elevation, location (survey markers and quad boundaries, for example), transportation and water. There are no query boxes, but a drop down list allows a quick selection of a county. Another nice touch is a simple "S" next to a layer that's only available at a certain scale. Hopefully, that reduces some confusion for new users or those who are familiar with scale dependent display. The site is already so heavily used, the main page details hardware upgrade plans.
City of Carmel, Indiana
It just so happens that the city of Carmel, Indiana is doing paving this summer. A press release covered at WISH TV Indianapolis offered details and a link to the city GIS website.
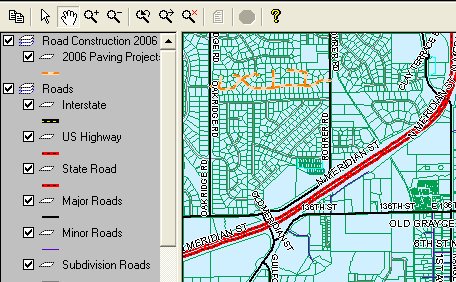 |
The city site uses MapGuide, and I needed to install the ActiveX control, which was simple after I gave my browser permission to do so. The layer of data on the road paving appears on top in the legend. While advanced tools for buffering and querying are available, it was a simple item that most pleased me. When I "moused over" properties and saw the parcel information, displayed in the lower left of the window was the name of the data layer – encoded with metadata: Parcels: April 2006:17-09-00 … I knew the data was from April of this year!
Chautauqua County, New York
The Post-Journal of Jamestown, New York introduced Chautauqua County's new online GIS. The website went live on July 1, 2006.
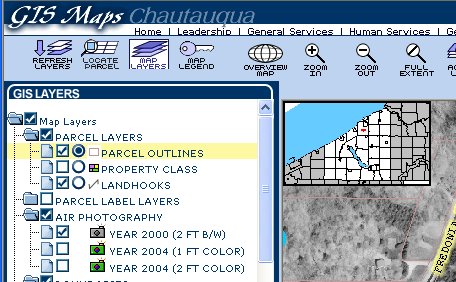 |
The county site has a full array of 18 tools across the top, including "locate parcel" and "select area." A few dozen data layers are available including imagery from 2000 and 2004. The black and white imagery uses a black and white camera icon; the color imagery, a colored icon. A few layers including voting districts, polling places and parks are noted as "coming soon." A pop-up list of municipalities makes it easy to get around, and for the map-savvy, it's possible to key-in a scale.
Canada's Agri-Environmental Portal
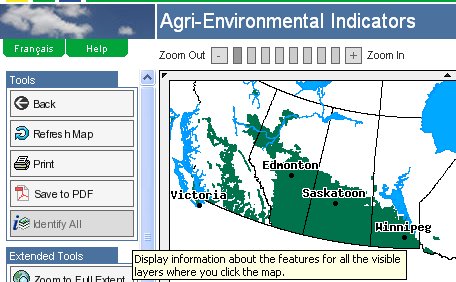
Canadian GIS was in the news, too. Eastern Ontario Agrinews covered an agri-environmental portal from the National Land and Water Information Service (NLWIS) of Agriculture and Agri-Food Canada (AAFC). Its goal? To provide "data, information, tools and expertise to support land use decision making."
 |
The Agri-Environmental Indicators choice, from a series of text menus, provides its own interface, loaded with appropriate data. On the upper right is a toggle, which by default limits the tools available; changing it to "on" turns on several more advanced navigation tools. That's a simple way to make the casual visitor comfortable without limiting more experienced users.
 |
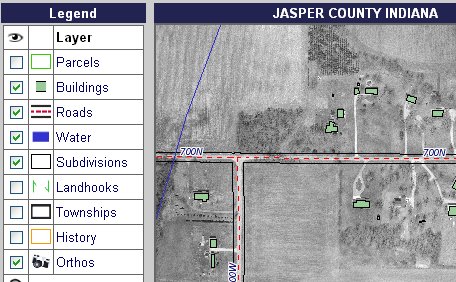
Jasper County, Indiana
Jasper County also launched a GIS website in the past weeks. The Rensselaer (Indiana) Republican noted the occasion. The Java-based app has just four tools and a few input boxes used to query on parcel, name, address and more. The ability to print the map out in several sizes is a nice feature. The only challenge at this site was remembering to click the "redraw map" button to refresh any changes recently made to layer visibility.
 |
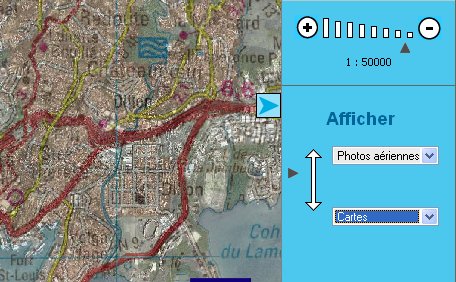
Geoportail, France
Just before the U.S. July 4th Independence Day holiday, France launched its new countrywide mapping website, Geoportail. There were many stories on this launch, most comparing the offering to Google Earth (some say unfairly) and noting how a burst of interest at launch brought the site to a standstill. (1, 2, 3) A few weeks later, after the buzz has died down, the site now loads quickly.
 |
The opening map is a French version of the "the sun never sets on the empire" map - with tiny French territories noted across the globe, along with France itself. I went immediately to Kwajelen in the South Pacific. (My dad spent some time there in the Army.) Alas, there were only maps, no images of the island. So I went to Martinique. There I found images, political maps and relief maps. And here's a nice touch, the ability to combine any two of those with any level of transparency.
Conclusion
While this selection of sites was far from representative and not very large, it did highlight a few things worth acknowledging.
- There are still jurisdictions launching Web mapping sites and applications in 2006.
- The combination of data and tools provided for the public ranges from limited to extensive.
- Sometimes it's very easy to ascertain the backend software. On the Carmel, Indiana website, the Autodesk logo is prominent in the plug in. Other times, there is no hint of the underlying technology, as is the case in the Canadian portal.
- Performance continues to be a challenge.
- The press is not only reporting on the launch of sites, but also using them to report important local and not-so-local news.
- Sites look very different one from another. That's nice from a jurisdictional branding standpoint: North Town's site should look different from South Town's. On the other hand, it may make it tougher for the user to learn each new site.
- While the overall usability of these sites is far higher than in the 1990s, there is still work to be done.
- While mash ups are getting much of the ink these days, GIS-based mapping websites seem to be alive and well… and well-used.
From Our Homepage
Saying Farewell to an Amazing Journey
Communicating with Maps
Is There a GIS Career Ladder?
What does it mean to be geospatially smart? Series
Ways Real Estate and Property Developers Utilize Melissa GeoData for Data-Driven Decisions
Unlocking Value From Daily Satellite Imagery and Insights
Maximizing the Value of Your Address Data with Geo Addressing
How Indoor Mapping Enhances the Security of Smart Buildings
Look Ahead: AI, Location Intelligence and Efficiency
Collaboration Takes on Sea Level Rise & Dynamic Technology Environments
Brownies for Brownfields
Has Everything Been Mapped Already?
How Is Data Literacy Changing in an Artificial Intelligence Landscape
Portfolios for GIS Professionals: More Than Just Maps
How to Create a Distance Matrix in QGIS - A Step-by-Step Guide
7 Ideas for Bringing GIS into the K-12 Classroom
The Geography of Movement