Picturesque St.Simons Island is a barrier island off
the coast of Georgia.With its moss-draped
oaks, shady lanes and creek-fed pockets of marsh, it is a thriving
habitat
for over 200 species of birds as well as sea turtles and other
wildlife.The members of St.Simons
Land Trust (Land Trust), conscious of the island's unique
environment and 250 years of history, wanted to balance conservation
and development goals.
Specifically, the Land Trust set out to create a strategic plan for carrying out a 10-year conservation strategy.Consulting firm PBS&J, from its Atlanta Planning and Landscape Architecture program, along with planner and urban designer H.Randal Roark, AIA, FAICP, worked with the Land Trust on a master plan, including community involvement and GIS mapping processes that resulted in a Greenprint Plan for St.Simons Island.
Information Design
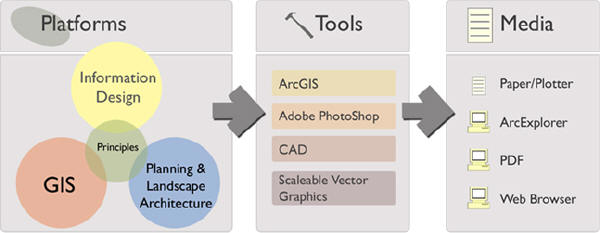
Community planning projects, such as the Greenprint Plan, use an extensive amount and variety of GIS data, such as coordinate data, environmental data and aerial imagery along with cognitive goals, messages and implied meanings.As stated by information design expert Nathan Shedroff, for data to have value, it must be organized, transformed and presented in a way that give it meaning to a target audience.Information design has evolved as a subset of graphic design to become a structural model for packaging information in a meaningful way.
In order for the project to be successful, we had to incorporate information design principles with the mapped GIS data to communicate the plan's ideas and goals.We used an approach that I have named "Info-GIS." Info-GIS applies the concepts of information design to GIS-based data and planning process products to reference, analyze and present community planning solutions.
Planning the Maps
For St.Simons Island, one of the first steps in the planning process was to conduct an island-wide survey of island residents' attitudes about green space issues.The Land Trust assembled an advisory committee from a broad cross-section of residents and property owners, and conducted workshops to gain additional opinions and information.
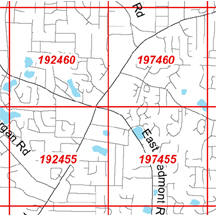
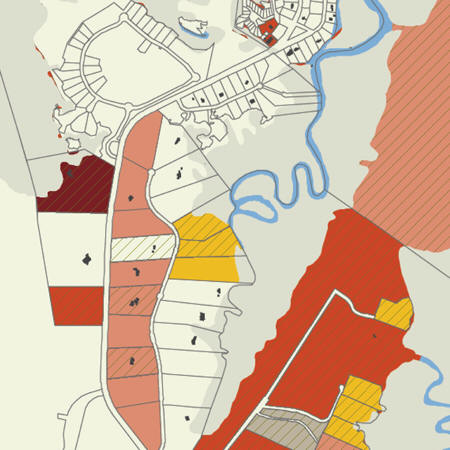
Next, we created a series of base maps.Aerial imagery, land cover, historic districts, parks and recreation sites and existing features as well as political, demographic, environmental and zoning/land use data were collected from sources including the Glynn County GIS Department (winner of an ESRI Special Achievement in GIS award in 2003), the Land Trust, an on-site visual survey and the National Wetlands Inventory.Every base map had its own importance and conveyed significantly varied information for comparative analysis.
These base maps laid the ground work for the planning team.As the
process evolved, we identified key elements and features of the island.
We selected the study area limits, deliverable size (each size of the
paper maps) and corresponding
map scale to maintain visual consistency throughout the
process.A simple, yet effective template was used to communicate the
graphic-intensive information displayed on the maps.
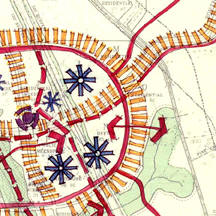
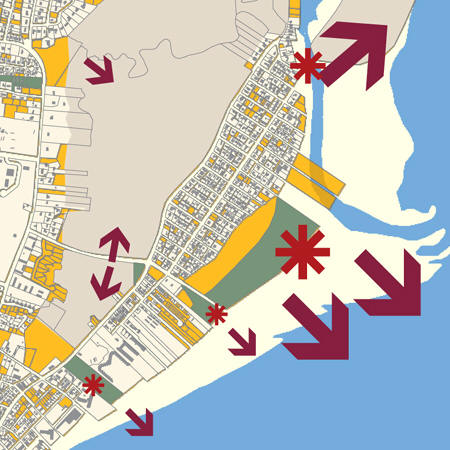
The crucial, final step was creating maps enriched by the citizens' input to aptly communicate Greenprint Plan objectives.These maps applied fundamentals of information design and incorporated the traditional planning and landscape architectural graphics to make the maps visually pleasing, and, at the same time, informative.
Mapping the Plans
The planning field brings its own guiding principles and practices to the table.For instance, colors, symbols, line weights and line types denote specific design elements.Info-GIS interprets these principles using modern tools and media.We've found one of the most useful among these high-tech solutions is ArcMap of the ArcGIS suite of products.It has proven compatible with information design tools for community planning purposes.
We used ArcMap to incorporate the principles and structural models of the many platforms community planners use. Although ArcMap provides numerous choices of line types, color and symbols, the real challenge lies in choosing the right symbol or color for effective communication.Effective information design blended with traditional planning principles helped shape the St.Simons Island Greenprint Plan.The maps define conservation desires and planning goals of the Land Trust and are easily understood with minimum explanatory text or legends.
Customizing the Tools
ArcMap makes a useful tool for practicing Info-GIS.ArcGIS version 8.X and newer versions have advantages over ArcView versions 3.X in terms of available and customizable line types, styles, fonts and marker symbols.These can be stored in a user-defined style file or as a layer and applied to all relevant data to maintain consistency with all the maps.Style files can also be modified, added or deleted by accessing the style manager.
Some of the key elements of the maps prepared for the St.Simons Greenprint Plan project were derived by customizing a line's properties.One example is the traditional planning symbol for a corridor incorporated into the Greenprint Initiatives Map.
Here's an example of how we were able to
customize the tools.These steps were used to create the "corridor"
planning symbol using
ArcMap.
Items in the Tool Box
ArcMap's compatibility with other graphic editing software extends its usefulness in community planning and information design.
Understanding ArcMap's compatibility with other Information Design tools is important when applying the concepts of Info-GIS.Adobe PhotoShop can be used to achieve color hue (RGB) values from real pictures and comparisons and to convert maps exported in EPS format into JPG format.Adobe Acrobat can convert ArcMap documents directly into the PDF format for deliverables and viewing with zoom capability.
Scalable Vector Graphics (SVG) software such as MapViewSVG allows ArcMap documents to be exported into SVG format and viewed on the Internet with the installation of a free SVG reader.Being a vector format document, the SVG format retains the quality of the elements of the map at any scale.
Macromedia Fontographer can create custom shapes and characters for use with ArcGIS group layer of style files.Finally, maps created with ArcMap can be exported in a variety of formats including EPS, JPG and PNG.The file size and display format can be controlled based on user needs.Note that the quality of each file varies based on file format.
Specifically, the Land Trust set out to create a strategic plan for carrying out a 10-year conservation strategy.Consulting firm PBS&J, from its Atlanta Planning and Landscape Architecture program, along with planner and urban designer H.Randal Roark, AIA, FAICP, worked with the Land Trust on a master plan, including community involvement and GIS mapping processes that resulted in a Greenprint Plan for St.Simons Island.
Information Design
Community planning projects, such as the Greenprint Plan, use an extensive amount and variety of GIS data, such as coordinate data, environmental data and aerial imagery along with cognitive goals, messages and implied meanings.As stated by information design expert Nathan Shedroff, for data to have value, it must be organized, transformed and presented in a way that give it meaning to a target audience.Information design has evolved as a subset of graphic design to become a structural model for packaging information in a meaningful way.
In order for the project to be successful, we had to incorporate information design principles with the mapped GIS data to communicate the plan's ideas and goals.We used an approach that I have named "Info-GIS." Info-GIS applies the concepts of information design to GIS-based data and planning process products to reference, analyze and present community planning solutions.
 |
For St.Simons Island, one of the first steps in the planning process was to conduct an island-wide survey of island residents' attitudes about green space issues.The Land Trust assembled an advisory committee from a broad cross-section of residents and property owners, and conducted workshops to gain additional opinions and information.
Next, we created a series of base maps.Aerial imagery, land cover, historic districts, parks and recreation sites and existing features as well as political, demographic, environmental and zoning/land use data were collected from sources including the Glynn County GIS Department (winner of an ESRI Special Achievement in GIS award in 2003), the Land Trust, an on-site visual survey and the National Wetlands Inventory.Every base map had its own importance and conveyed significantly varied information for comparative analysis.
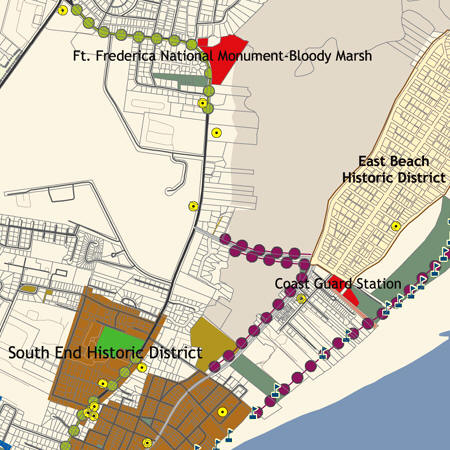 |
The crucial, final step was creating maps enriched by the citizens' input to aptly communicate Greenprint Plan objectives.These maps applied fundamentals of information design and incorporated the traditional planning and landscape architectural graphics to make the maps visually pleasing, and, at the same time, informative.
 |
 |
The planning field brings its own guiding principles and practices to the table.For instance, colors, symbols, line weights and line types denote specific design elements.Info-GIS interprets these principles using modern tools and media.We've found one of the most useful among these high-tech solutions is ArcMap of the ArcGIS suite of products.It has proven compatible with information design tools for community planning purposes.
We used ArcMap to incorporate the principles and structural models of the many platforms community planners use. Although ArcMap provides numerous choices of line types, color and symbols, the real challenge lies in choosing the right symbol or color for effective communication.Effective information design blended with traditional planning principles helped shape the St.Simons Island Greenprint Plan.The maps define conservation desires and planning goals of the Land Trust and are easily understood with minimum explanatory text or legends.
 |
 |
ArcMap makes a useful tool for practicing Info-GIS.ArcGIS version 8.X and newer versions have advantages over ArcView versions 3.X in terms of available and customizable line types, styles, fonts and marker symbols.These can be stored in a user-defined style file or as a layer and applied to all relevant data to maintain consistency with all the maps.Style files can also be modified, added or deleted by accessing the style manager.
Some of the key elements of the maps prepared for the St.Simons Greenprint Plan project were derived by customizing a line's properties.One example is the traditional planning symbol for a corridor incorporated into the Greenprint Initiatives Map.
 |
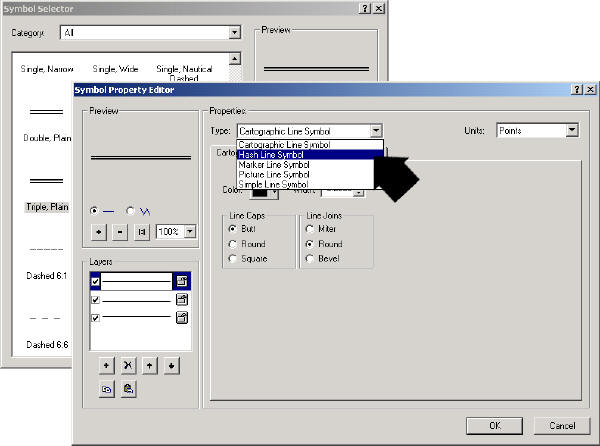
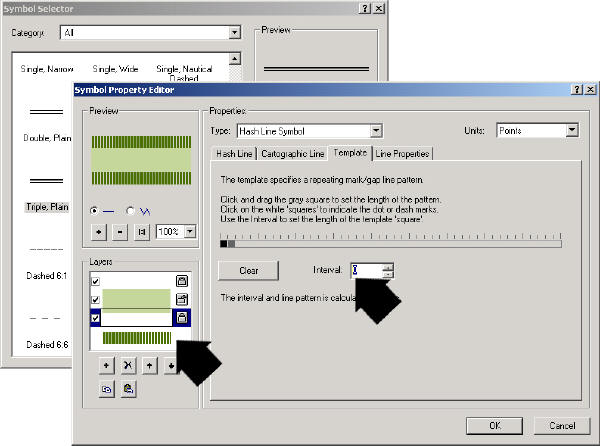
- Create a new shapefile with the required corridor delineation.The line style that ArcMap selects by default will usually be a plain single line with some default color.Click on the line type in order to change the symbol.In the "Symbol Selector" dialog, choose a simple "Triple Plain" line type from the available line types.
- Click
on "Properties" and
change the line type to "Hash Line Symbol."
 |
- Changing the line type to "Hash Line Symbol" will make all three parts of the line available for editing.Change the width of the first and third part to 12.
- Click on the middle part and change its width to 24 and color to "Lime Green." Increase the offset of the top and bottom lines to 20.
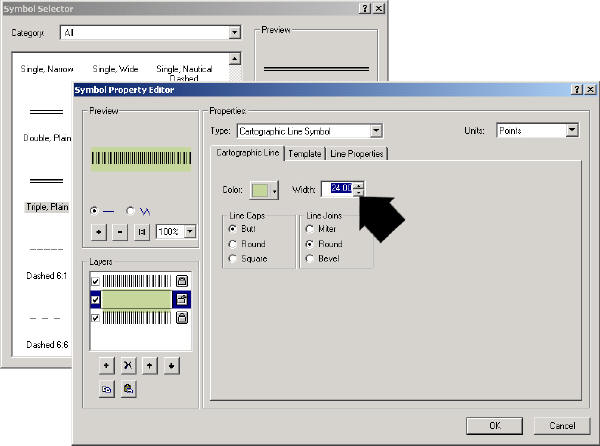 |
- Click on "Template" tab and change the intervals of the top and bottom line to "0" and click "OK."
- The custom "corridor" symbol can thus be achieved and its width can be changed to match visual requirements.
 |
Items in the Tool Box
ArcMap's compatibility with other graphic editing software extends its usefulness in community planning and information design.
Understanding ArcMap's compatibility with other Information Design tools is important when applying the concepts of Info-GIS.Adobe PhotoShop can be used to achieve color hue (RGB) values from real pictures and comparisons and to convert maps exported in EPS format into JPG format.Adobe Acrobat can convert ArcMap documents directly into the PDF format for deliverables and viewing with zoom capability.
Scalable Vector Graphics (SVG) software such as MapViewSVG allows ArcMap documents to be exported into SVG format and viewed on the Internet with the installation of a free SVG reader.Being a vector format document, the SVG format retains the quality of the elements of the map at any scale.
Macromedia Fontographer can create custom shapes and characters for use with ArcGIS group layer of style files.Finally, maps created with ArcMap can be exported in a variety of formats including EPS, JPG and PNG.The file size and display format can be controlled based on user needs.Note that the quality of each file varies based on file format.
From Our Homepage
Saying Farewell to an Amazing Journey
Communicating with Maps
Is There a GIS Career Ladder?
What does it mean to be geospatially smart? Series
Ways Real Estate and Property Developers Utilize Melissa GeoData for Data-Driven Decisions
Unlocking Value From Daily Satellite Imagery and Insights
Maximizing the Value of Your Address Data with Geo Addressing
How Indoor Mapping Enhances the Security of Smart Buildings
Look Ahead: AI, Location Intelligence and Efficiency
Collaboration Takes on Sea Level Rise & Dynamic Technology Environments
Brownies for Brownfields
Has Everything Been Mapped Already?
How Is Data Literacy Changing in an Artificial Intelligence Landscape
Portfolios for GIS Professionals: More Than Just Maps
How to Create a Distance Matrix in QGIS - A Step-by-Step Guide
7 Ideas for Bringing GIS into the K-12 Classroom
The Geography of Movement