Ed. note: This article was updated to add Figure 3 based on a reader's suggestion.
The predominant development in 2008 is not growth, but decline - the fallout from the downturn in the housing market. There are still areas of growth, pockets of prosperity to report; however, there are few areas untouched by the decline of the housing market and the ensuing credit crunch.
The depreciation in home value hit the hottest housing markets first, and hardest. From 2000 through 2007, the top twenty housing markets experienced double-digit appreciation in home value, an average of 15 percent annually. From 2007 to 2008, the change in home value for these markets dropped by an average of 23 percent. Average annual population change in these markets also fell, from an annual average of 2.9 percent in 2000 to 2007, to 1.4 percent in 2007 to 2008.(See Figure 1 - 2008 Median Home Value, and Figure 2 - 2008 Owner-Occupied Housing; both by Census Tract)
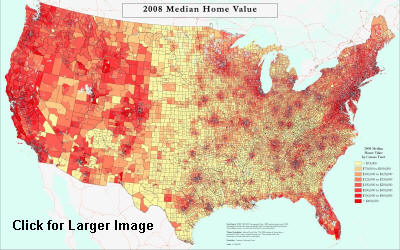
Figure 1
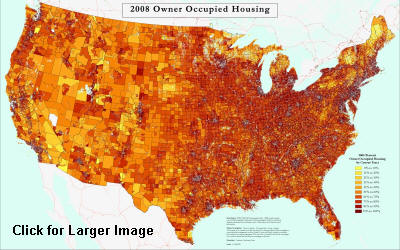
Figure 2
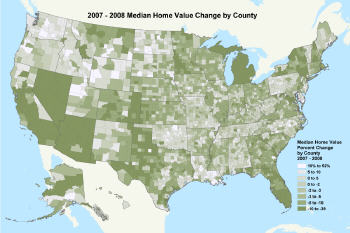
Figure 3 (Click for larger image)
This slowdown has seeped through most of the 940 U.S. metropolitan and micropolitan areas. In the past year, home value has shifted from appreciation to loss in 73 percent of the markets; population change has decreased in 62 percent. Even nonmetropolitan counties are showing the effects of the decline in the housing market. Comparing the average annual rate of change in home value through 2007 to the rate in 2007-2008, almost half of the counties experienced a drop of 10 percentage points or more—from an average increase of 7.6 percent to an average decrease of 9.3 percent.
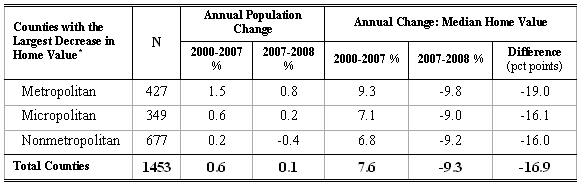
* The drop in home value rates of change from 2000-2007 to 2007-2008 is greater than or equal to 10 percentage points
Home value is declining; population growth is contracting. Vacancy rates are increasing from foreclosures on owner-occupied homes, and the rate of homeownership has declined. These changes are pervasive, not limited to the hottest markets or the most rapidly growing areas. What other effects are evident from the downturn in the housing market?
The U.S. economy has fallen flat. The past two downturns were brief enough to create a sense of near economic infallibility. The current outlook is less sanguine. Today, the ubiquitous footnote accompanying every financial prospectus or retirement statement has never been more apropos: “Past performance is no guarantee of future results.”
Real gross domestic production (GDP), the inflation-adjusted dollar value of all goods and services produced in the economy, slowed to an annualized rate of 0.6 percent in the fourth quarter of 2007 and continued at 0.6 percent in the first quarter of 2008. Although 2007 began at the same slow rate, economic activity increased in the second and third quarters of 2007, at 3.8 and 4.9 percent, respectively. What is causing anxiety now, and a belief that the worst is yet to come?
First, the bad news continues in the slumping housing sector and credit markets. Foreclosures increased by 112 percent in the first quarter of 2008, compared with the first quarter of 2007. As the volume of defaults, delinquencies and foreclosures increases, banks are responding by slowing the extension of credit—not only for mortgages, but also for small businesses in industries unrelated to the housing sector. Business loans, if granted at all, are being offered under less favorable lending terms.
On the consumer side, the decrease in home value has caused home equity lines of credit to dry up as a reliable source for funds. Many cash-strapped households are turning to credit cards for everyday expenses—not just for big-ticket purchases. Card issuers are beginning to raise rates, reduce credit availability, or both.
Adding to consumer uneasiness are record-setting increases in gasoline prices, following the continuing rise in the price of crude oil. With the aggressive steps taken by the Federal Reserve to drop interest rates, a renewed fear of inflation has emerged. Consumers are experiencing higher prices at the pump, in home heating costs and at the grocery store. Although the data do not show inflation rising yet, higher prices are surfacing globally. The value of the dollar is dropping, and commodities such as gold, considered an insurance policy against future inflation, are trading at record prices.
As inflation and tightening credit erode the buying power of consumers, the slowdown in economic activity is beginning to filter to the labor market. ESRI expects a gain of only 582,000 jobs compared with employment growth of 2.4 million jobs last year. Although the sluggish pace of job creation affects all regions of the country, states in the South and Midwest are the most disturbed. The unemployment rate has also increased to 6.9 percent, and the rate of labor force participation, which measures the proportion of the working age population who are employed or actively seeking work, has shrunk to 62.8 percent.
Effects of the housing market downturn and tightening of credit are pervasive and growing—just now beginning to show in the labor market. Coupled with rising food and fuel costs, the economic fallout is likely to continue through 2008. What are the long-range prospects for U.S. households? Is this the beginning of a long-term slowdown or a market correction?
Home prices continue to decrease, by another 4.6 percent in April according to the Office of Federal Housing Enterprise Oversight. However, the resulting improvement in housing affordability may begin to stabilize the market. There is still a large inventory of unsold homes, which may take several months to reduce, but most analysts expect the housing market to begin recovery in 2009. However, that expectation is predicated upon the actions of Congress and the Federal Reserve Board to stabilize the financial sector, and the reactions of consumers to changes such as rising fuel costs.
For now, Congress has not yet passed the bill to provide some respite to homeowners who are facing foreclosure. In the long run, the future of the housing market will also depend upon demographic change. The possible effects of retirement on the Baby Boomers’ lifestyles and choices of housing remain subjects for speculation by housing analysts. The demographic force that fueled housing demand for the past three decades could provoke another downturn in the housing market—if they decide to sell their current homes in favor of retirement communities or apartments.
Although Baby Boomers are critical in the changing demographic landscape, their children, the Echo Effect or Generation Y, rival them closely. This cohort is 77 million strong in 2008. By 2013, Echo Boomers will outnumber the Baby Boomers by nearly 2 million and range from college-age to mid-30s. They are more ethnically diverse than their parents, and their housing preferences and needs are also likely to diverge from those of their parents. Although the focus in housing research and the media has been centered on the Baby Boomers, it is equally important to account for the Echo Boomers and their choices. Their ability to purchase homes may greatly affect the viability of the future housing market.
For more information, visit ESRI’s demographic data website.
The predominant development in 2008 is not growth, but decline - the fallout from the downturn in the housing market. There are still areas of growth, pockets of prosperity to report; however, there are few areas untouched by the decline of the housing market and the ensuing credit crunch.
The depreciation in home value hit the hottest housing markets first, and hardest. From 2000 through 2007, the top twenty housing markets experienced double-digit appreciation in home value, an average of 15 percent annually. From 2007 to 2008, the change in home value for these markets dropped by an average of 23 percent. Average annual population change in these markets also fell, from an annual average of 2.9 percent in 2000 to 2007, to 1.4 percent in 2007 to 2008.(See Figure 1 - 2008 Median Home Value, and Figure 2 - 2008 Owner-Occupied Housing; both by Census Tract)

Figure 1

Figure 2
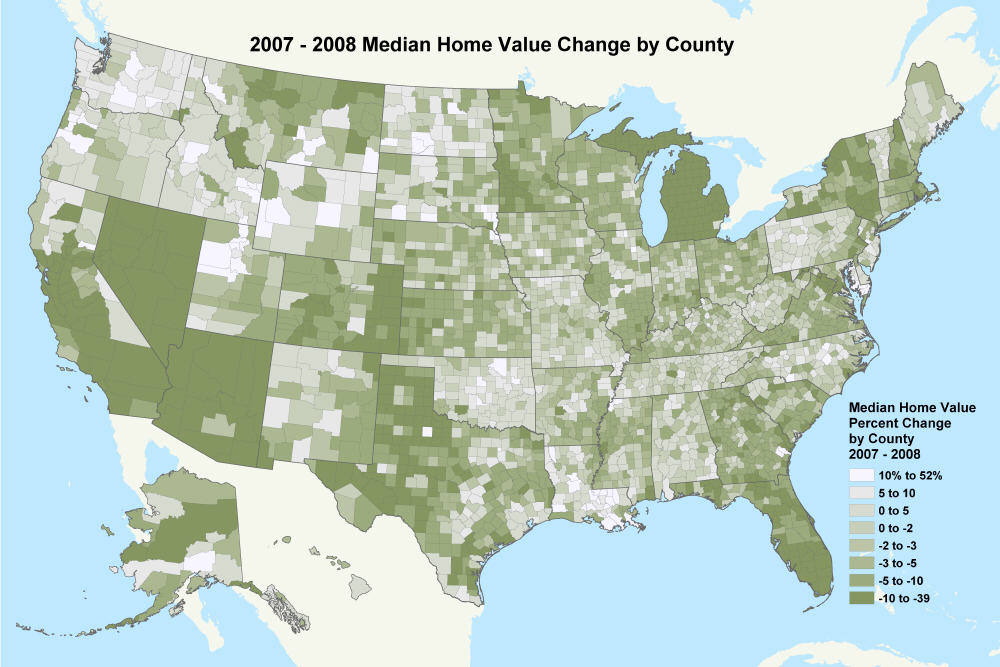
Figure 3 (Click for larger image)
This slowdown has seeped through most of the 940 U.S. metropolitan and micropolitan areas. In the past year, home value has shifted from appreciation to loss in 73 percent of the markets; population change has decreased in 62 percent. Even nonmetropolitan counties are showing the effects of the decline in the housing market. Comparing the average annual rate of change in home value through 2007 to the rate in 2007-2008, almost half of the counties experienced a drop of 10 percentage points or more—from an average increase of 7.6 percent to an average decrease of 9.3 percent.
* The drop in home value rates of change from 2000-2007 to 2007-2008 is greater than or equal to 10 percentage points
Home value is declining; population growth is contracting. Vacancy rates are increasing from foreclosures on owner-occupied homes, and the rate of homeownership has declined. These changes are pervasive, not limited to the hottest markets or the most rapidly growing areas. What other effects are evident from the downturn in the housing market?
The U.S. economy has fallen flat. The past two downturns were brief enough to create a sense of near economic infallibility. The current outlook is less sanguine. Today, the ubiquitous footnote accompanying every financial prospectus or retirement statement has never been more apropos: “Past performance is no guarantee of future results.”
Real gross domestic production (GDP), the inflation-adjusted dollar value of all goods and services produced in the economy, slowed to an annualized rate of 0.6 percent in the fourth quarter of 2007 and continued at 0.6 percent in the first quarter of 2008. Although 2007 began at the same slow rate, economic activity increased in the second and third quarters of 2007, at 3.8 and 4.9 percent, respectively. What is causing anxiety now, and a belief that the worst is yet to come?
First, the bad news continues in the slumping housing sector and credit markets. Foreclosures increased by 112 percent in the first quarter of 2008, compared with the first quarter of 2007. As the volume of defaults, delinquencies and foreclosures increases, banks are responding by slowing the extension of credit—not only for mortgages, but also for small businesses in industries unrelated to the housing sector. Business loans, if granted at all, are being offered under less favorable lending terms.
On the consumer side, the decrease in home value has caused home equity lines of credit to dry up as a reliable source for funds. Many cash-strapped households are turning to credit cards for everyday expenses—not just for big-ticket purchases. Card issuers are beginning to raise rates, reduce credit availability, or both.
Adding to consumer uneasiness are record-setting increases in gasoline prices, following the continuing rise in the price of crude oil. With the aggressive steps taken by the Federal Reserve to drop interest rates, a renewed fear of inflation has emerged. Consumers are experiencing higher prices at the pump, in home heating costs and at the grocery store. Although the data do not show inflation rising yet, higher prices are surfacing globally. The value of the dollar is dropping, and commodities such as gold, considered an insurance policy against future inflation, are trading at record prices.
As inflation and tightening credit erode the buying power of consumers, the slowdown in economic activity is beginning to filter to the labor market. ESRI expects a gain of only 582,000 jobs compared with employment growth of 2.4 million jobs last year. Although the sluggish pace of job creation affects all regions of the country, states in the South and Midwest are the most disturbed. The unemployment rate has also increased to 6.9 percent, and the rate of labor force participation, which measures the proportion of the working age population who are employed or actively seeking work, has shrunk to 62.8 percent.
Effects of the housing market downturn and tightening of credit are pervasive and growing—just now beginning to show in the labor market. Coupled with rising food and fuel costs, the economic fallout is likely to continue through 2008. What are the long-range prospects for U.S. households? Is this the beginning of a long-term slowdown or a market correction?
Home prices continue to decrease, by another 4.6 percent in April according to the Office of Federal Housing Enterprise Oversight. However, the resulting improvement in housing affordability may begin to stabilize the market. There is still a large inventory of unsold homes, which may take several months to reduce, but most analysts expect the housing market to begin recovery in 2009. However, that expectation is predicated upon the actions of Congress and the Federal Reserve Board to stabilize the financial sector, and the reactions of consumers to changes such as rising fuel costs.
For now, Congress has not yet passed the bill to provide some respite to homeowners who are facing foreclosure. In the long run, the future of the housing market will also depend upon demographic change. The possible effects of retirement on the Baby Boomers’ lifestyles and choices of housing remain subjects for speculation by housing analysts. The demographic force that fueled housing demand for the past three decades could provoke another downturn in the housing market—if they decide to sell their current homes in favor of retirement communities or apartments.
Although Baby Boomers are critical in the changing demographic landscape, their children, the Echo Effect or Generation Y, rival them closely. This cohort is 77 million strong in 2008. By 2013, Echo Boomers will outnumber the Baby Boomers by nearly 2 million and range from college-age to mid-30s. They are more ethnically diverse than their parents, and their housing preferences and needs are also likely to diverge from those of their parents. Although the focus in housing research and the media has been centered on the Baby Boomers, it is equally important to account for the Echo Boomers and their choices. Their ability to purchase homes may greatly affect the viability of the future housing market.
For more information, visit ESRI’s demographic data website.
From Our Homepage
Saying Farewell to an Amazing Journey
Communicating with Maps
Is There a GIS Career Ladder?
What does it mean to be geospatially smart? Series
Ways Real Estate and Property Developers Utilize Melissa GeoData for Data-Driven Decisions
Unlocking Value From Daily Satellite Imagery and Insights
Maximizing the Value of Your Address Data with Geo Addressing
How Indoor Mapping Enhances the Security of Smart Buildings
Look Ahead: AI, Location Intelligence and Efficiency
Collaboration Takes on Sea Level Rise & Dynamic Technology Environments
Brownies for Brownfields
Has Everything Been Mapped Already?
How Is Data Literacy Changing in an Artificial Intelligence Landscape
Portfolios for GIS Professionals: More Than Just Maps
How to Create a Distance Matrix in QGIS - A Step-by-Step Guide
7 Ideas for Bringing GIS into the K-12 Classroom
The Geography of Movement