Katrina Democratizes Geospatial Technology
The Katrina event brought GIS and spatial technologies into the forefront of many people's minds.After the evacuation, tens of thousands of people were grasping for any information they could find about their homes and businesses.Familiarity with geo-viewing tools like Google Earth, Google Maps, NASA WorldWind, and Microsoft Virtual Earth and access to the Internet gave people the means to investigate their own personal situations from afar - utilizing tools similar to those geospatial practitioners have used for years.A mass democratization of geospatial technologies took place in the country's time of crisis.
There are two sides to the geospatial coin, however.First are the tools and interfaces, of which many in the geospatial community are well aware.Second are the data, the critical currency that provides timeliness, accuracy and relevance.This article will discuss the group of open source GIS developers, academics and private industry folks who developed and deployed the Katrina Imagery Warehouse to aggregate and provide access to Katrina disaster data in real-time, as the situation unfolded.
A Heterogeneous Group Responds
This story starts a few days after the hurricane when the National Oceanographic and Atmospheric Administration (NOAA) released its Applanix/Emerge-collected imagery for the affected areas.While NOAA has the capabilities to generate ortho photography, it made the decision to continue to focus its efforts on mass data collection and providing image trajectories, and left the job of ortho-rectifying and mosaicking the imagery to others.One individual quickly saw that this job needed to be done and decided he had the resources to do it an email client, a Web browser, an Internet Relay Chat (IRC) connection and the network.That individual was Norman Vine, of the Woods Hole Oceanographic Institution and the University of New Hampshire.
Howard Rheingold, author of Smart Mobs, made a point in his book about communities of individuals springing up around their common interests, and access to powerful communication technologies.Vine decided to create a mob around ortho-rectifying the NOAA imagery with a goal of providing the data in as many formats possible with whatever means it could gather.This mob eventually became the cast of characters that coalesced into the Katrina Imagery Warehouse project team.
The Team: First Wave
Enter members of the OSSIM team. Vine had been collaborating with OSSIM members on osgPlanet, a 3D viewer for OGC WMS and native format geospatial data.OSSIM is the open source raster processing guts of many commercial, government and open source software packages.It excels at creating image processing chains for tasks like ortho-rectifying and mosaicking.After inspecting the data, members of the OSSIM team, including Mark Lucas, Garrett Potts and Scott Bortman, approximated an Applanix sensor model.[A sensor model is an understanding of the geometry of the sensor.It's needed to process the raw data.]
Next on board was John Graham of TelaScience. Graham describes TelaScience as "my answer to many scientists and educators requests for service and support." Vine had met Graham virtually during some of the recent Mars Lander missions.Vine provided some tools to create natural color images of the mission and tools to visualize mission data.He knew of TelaScience's (and San Diego State University's) access to significant computing horsepower and copious bandwidth - two resources that were to be in high demand when it came to dealing with the gigabytes of NOAA Katrina imagery.Vine and Graham quickly connected via the network and set to gathering more resources that would be necessary to reach their common goal.
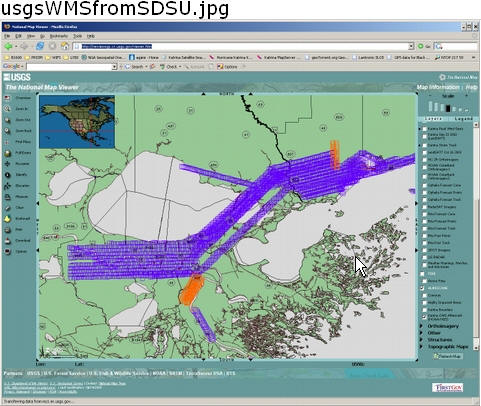
Now with the sensor model and computing resources, Vine, Graham, and the OSSIM team set the eight-processor SGI Prism visualization system at SDSU cooking the NOAA imagery.The imagery was color-corrected and mosaicked using OSSIM and GDAL [an open source translator library for raster geospatial data formats] and compiled into a tile index that could be initially used in UMN MapServer.Open source MapServer provides Open Geospatial Consortium (OGC) Web Map Service (WMS) support out of the box with simple additions to its configuration parameters.An initial website containing a WMS capabilities URL with links to the imagery was available within several days of the data being captured.
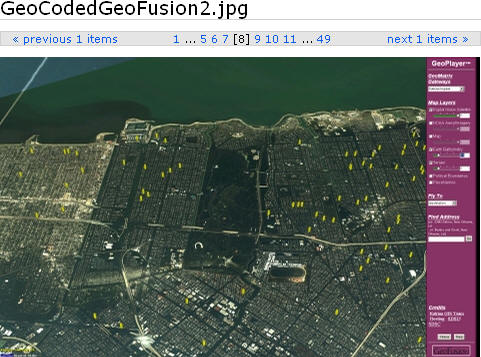
Chuck Stein, of GeoFusion, has collaborated with Graham for the last few years on various projects such as Mars and southeast Asia tsunami visualization.Stein worked with the TelaScience team to process much of the data, including DigitalGlobe Quickbird and NOAA imagery, into the GeoMatrix 3D render-ready format for use with GeoFusion's GeoPlayer 3D ActiveX Web browser-enabled viewer.By querying against the WMS, Charles was able to create the GeoMatrix version of the data for the GeoFusion software.
The Team: The Second Wave
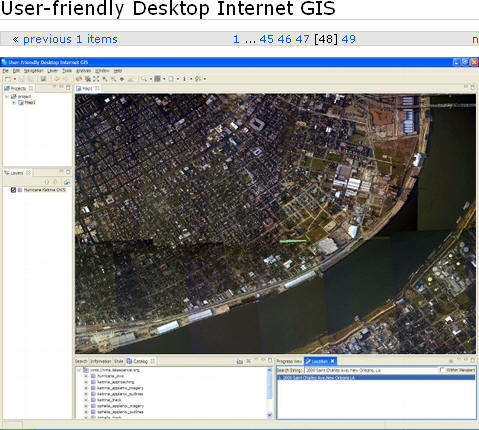
Once the first mosaic was created, more members of the team started to come on board through the initial group.Each member brought skills, software and time to the project.More data relevant to the disaster was acquired and processed at a dizzying pace, and the group provisioned the data in as many formats as they could to provide the widest access possible to the data.The final tally of formats/services included WMS, GeoMatrix, NASA WorldWind, Google Earth, GeoTIFF, RAW and ArcIMS.All the formats except GeoMatrix were created and compiled using open source software.(Here's a list of all the open source software used.)
With the initial data prepared and made available, other people contributed in various ways.Mario Beauchamp used his open source image fusion tool to provide pansharpening of Landsat imagery of the affected areas.Tom Kralidis, of Environment Canada and all-around OGC guru, stepped in to ensure OGC conformance in the MapServer map files. Consultant (and author of this article) Howard Butler participated by implementing geocoding and providing some help files and instructions for using the data and software resources.
Here are a sample of images from the Katrina Imagery Warehouse. You can visit the warehouse to view many more images.
The 12th Man
People with a willingness to help, access to network bandwidth, and ample computing horsepower are only three of the essential ingredients that made this project work.The other important component was the software.Powerful tools that can be easily integrated provide great leverage during a crunch if data access and storage standards are widely implemented.Many of the tools used in this project were open source, and frequently, developers brought software they had written themselves to the project.By implementing standards like OGC WMS, the software allowed members of the team to fit pieces in where they were needed.
Without defined standards or software that team members could easily downloaded, the project would not have been as successful or as timely. Anyone who has attempted to integrate many different pieces of software knows how challenging such an enterprise can be.Attempting to implement a tightly integrated system under a high traffic load (almost 1.9 million hits and 570 gb of traffic while the system was being implemented), a rapidly changing situation, and an onrush of data was even more challenging.The tools allowed the smiths to hammer out a scaleable and full-featured system because they were designed so that they could be easily integrated with others.
Conclusion
Moved by the enormity of the disaster, members of the team mostly contributed to the project outside of their normal day jobs. Infrastructure from SDSU gave the team capacity to have a wide-ranging impact, and open source software played an important part in giving the team the ability to leverage their expertise.This project demonstrates what a highly motivated mob connected over the network can accomplish.
The Katrina event brought GIS and spatial technologies into the forefront of many people's minds.After the evacuation, tens of thousands of people were grasping for any information they could find about their homes and businesses.Familiarity with geo-viewing tools like Google Earth, Google Maps, NASA WorldWind, and Microsoft Virtual Earth and access to the Internet gave people the means to investigate their own personal situations from afar - utilizing tools similar to those geospatial practitioners have used for years.A mass democratization of geospatial technologies took place in the country's time of crisis.
There are two sides to the geospatial coin, however.First are the tools and interfaces, of which many in the geospatial community are well aware.Second are the data, the critical currency that provides timeliness, accuracy and relevance.This article will discuss the group of open source GIS developers, academics and private industry folks who developed and deployed the Katrina Imagery Warehouse to aggregate and provide access to Katrina disaster data in real-time, as the situation unfolded.
A Heterogeneous Group Responds
This story starts a few days after the hurricane when the National Oceanographic and Atmospheric Administration (NOAA) released its Applanix/Emerge-collected imagery for the affected areas.While NOAA has the capabilities to generate ortho photography, it made the decision to continue to focus its efforts on mass data collection and providing image trajectories, and left the job of ortho-rectifying and mosaicking the imagery to others.One individual quickly saw that this job needed to be done and decided he had the resources to do it an email client, a Web browser, an Internet Relay Chat (IRC) connection and the network.That individual was Norman Vine, of the Woods Hole Oceanographic Institution and the University of New Hampshire.
Howard Rheingold, author of Smart Mobs, made a point in his book about communities of individuals springing up around their common interests, and access to powerful communication technologies.Vine decided to create a mob around ortho-rectifying the NOAA imagery with a goal of providing the data in as many formats possible with whatever means it could gather.This mob eventually became the cast of characters that coalesced into the Katrina Imagery Warehouse project team.
The Team: First Wave
Enter members of the OSSIM team. Vine had been collaborating with OSSIM members on osgPlanet, a 3D viewer for OGC WMS and native format geospatial data.OSSIM is the open source raster processing guts of many commercial, government and open source software packages.It excels at creating image processing chains for tasks like ortho-rectifying and mosaicking.After inspecting the data, members of the OSSIM team, including Mark Lucas, Garrett Potts and Scott Bortman, approximated an Applanix sensor model.[A sensor model is an understanding of the geometry of the sensor.It's needed to process the raw data.]
Next on board was John Graham of TelaScience. Graham describes TelaScience as "my answer to many scientists and educators requests for service and support." Vine had met Graham virtually during some of the recent Mars Lander missions.Vine provided some tools to create natural color images of the mission and tools to visualize mission data.He knew of TelaScience's (and San Diego State University's) access to significant computing horsepower and copious bandwidth - two resources that were to be in high demand when it came to dealing with the gigabytes of NOAA Katrina imagery.Vine and Graham quickly connected via the network and set to gathering more resources that would be necessary to reach their common goal.
Now with the sensor model and computing resources, Vine, Graham, and the OSSIM team set the eight-processor SGI Prism visualization system at SDSU cooking the NOAA imagery.The imagery was color-corrected and mosaicked using OSSIM and GDAL [an open source translator library for raster geospatial data formats] and compiled into a tile index that could be initially used in UMN MapServer.Open source MapServer provides Open Geospatial Consortium (OGC) Web Map Service (WMS) support out of the box with simple additions to its configuration parameters.An initial website containing a WMS capabilities URL with links to the imagery was available within several days of the data being captured.
Chuck Stein, of GeoFusion, has collaborated with Graham for the last few years on various projects such as Mars and southeast Asia tsunami visualization.Stein worked with the TelaScience team to process much of the data, including DigitalGlobe Quickbird and NOAA imagery, into the GeoMatrix 3D render-ready format for use with GeoFusion's GeoPlayer 3D ActiveX Web browser-enabled viewer.By querying against the WMS, Charles was able to create the GeoMatrix version of the data for the GeoFusion software.
The Team: The Second Wave
Once the first mosaic was created, more members of the team started to come on board through the initial group.Each member brought skills, software and time to the project.More data relevant to the disaster was acquired and processed at a dizzying pace, and the group provisioned the data in as many formats as they could to provide the widest access possible to the data.The final tally of formats/services included WMS, GeoMatrix, NASA WorldWind, Google Earth, GeoTIFF, RAW and ArcIMS.All the formats except GeoMatrix were created and compiled using open source software.(Here's a list of all the open source software used.)
With the initial data prepared and made available, other people contributed in various ways.Mario Beauchamp used his open source image fusion tool to provide pansharpening of Landsat imagery of the affected areas.Tom Kralidis, of Environment Canada and all-around OGC guru, stepped in to ensure OGC conformance in the MapServer map files. Consultant (and author of this article) Howard Butler participated by implementing geocoding and providing some help files and instructions for using the data and software resources.
Here are a sample of images from the Katrina Imagery Warehouse. You can visit the warehouse to view many more images.
 |
 |
 |
The 12th Man
People with a willingness to help, access to network bandwidth, and ample computing horsepower are only three of the essential ingredients that made this project work.The other important component was the software.Powerful tools that can be easily integrated provide great leverage during a crunch if data access and storage standards are widely implemented.Many of the tools used in this project were open source, and frequently, developers brought software they had written themselves to the project.By implementing standards like OGC WMS, the software allowed members of the team to fit pieces in where they were needed.
Without defined standards or software that team members could easily downloaded, the project would not have been as successful or as timely. Anyone who has attempted to integrate many different pieces of software knows how challenging such an enterprise can be.Attempting to implement a tightly integrated system under a high traffic load (almost 1.9 million hits and 570 gb of traffic while the system was being implemented), a rapidly changing situation, and an onrush of data was even more challenging.The tools allowed the smiths to hammer out a scaleable and full-featured system because they were designed so that they could be easily integrated with others.
Conclusion
Moved by the enormity of the disaster, members of the team mostly contributed to the project outside of their normal day jobs. Infrastructure from SDSU gave the team capacity to have a wide-ranging impact, and open source software played an important part in giving the team the ability to leverage their expertise.This project demonstrates what a highly motivated mob connected over the network can accomplish.
From Our Homepage
Saying Farewell to an Amazing Journey
Communicating with Maps
Is There a GIS Career Ladder?
What does it mean to be geospatially smart? Series
Ways Real Estate and Property Developers Utilize Melissa GeoData for Data-Driven Decisions
Unlocking Value From Daily Satellite Imagery and Insights
Maximizing the Value of Your Address Data with Geo Addressing
How Indoor Mapping Enhances the Security of Smart Buildings
Look Ahead: AI, Location Intelligence and Efficiency
Collaboration Takes on Sea Level Rise & Dynamic Technology Environments
Brownies for Brownfields
Has Everything Been Mapped Already?
How Is Data Literacy Changing in an Artificial Intelligence Landscape
Portfolios for GIS Professionals: More Than Just Maps
How to Create a Distance Matrix in QGIS - A Step-by-Step Guide
7 Ideas for Bringing GIS into the K-12 Classroom
The Geography of Movement