Kenton, Campbell and Pendleton counties form one of the
fastest growing regions in the Commonwealth of Kentucky. As such, the
Northern Kentucky Area Planning Commission (NKAPC), which supports this area,
needed a stronger reporting solution to keep track of applications for
permits, zoning and land development as well as be a watchdog for code
enforcement. To support the reporting capabilities, the staff at the
NKAPC believed that they could tie the information to maps, which would
help visualize a variety of information involving geographic
relationships.
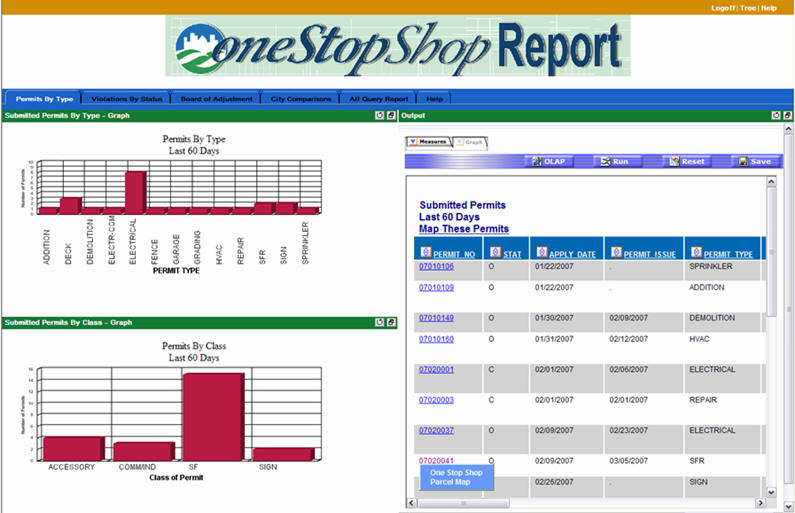
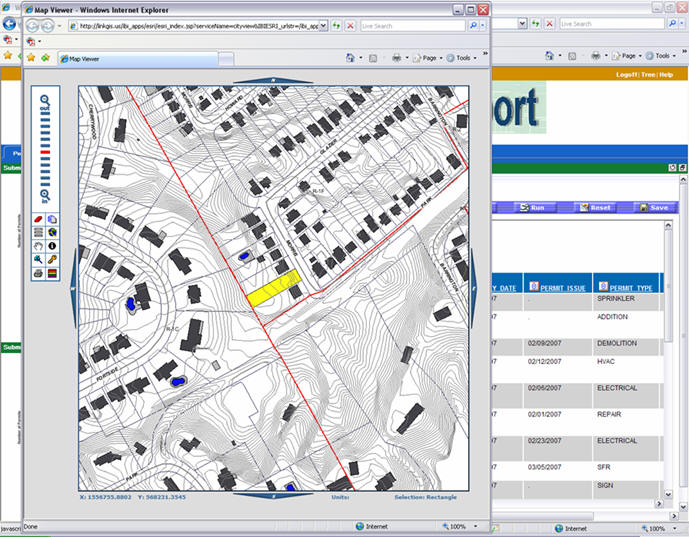
NKAPC had previously purchased software to track zoning and permitting applications and was storing the information in an INFORMIX database. But the organization still needed a reporting solution that would help extract information. Mike Schwartz of the NKAPC's Current Planning Department believed that using the planning commission's GIS technology would also be extremely beneficial. So the NKAPC turned to Information Builders Inc. (IBI) for its reporting solutions to allow the permitting data to be sent to constituent cities in the region through email blasts on a regular schedule. A consultant developed a dashboard within IBI's WEBFocus system and incorporated the GIS component (see figures 1 and 2) to see where permits were being issued, produce code enforcement reports, and determine where there might be code violations. "We have used ArcIMS for a number of years and so they (city administrators and staff) are accustomed to looking at maps but not with respect to permits," said Schwartz.
In the future, instead of having the map pop up at the end of the process, the NKAPC wants the ability to type an address and have the map show that location first; then click on the map to retrieve a dashboard with a series of tabs where each tab would be a different component of the data. Schwartz gave the example of frequent zoning changes. When a change occurs, he wants to drill down to get staff reports, city actions, development plans and anything related to that address. "Today's 100 acre farm is tomorrow's subdivision with 300 lots, 300 addresses and 300 property identification numbers. How do you take an address of today and find information about that area years from now where the only link to that data was the geometry?" said Schwartz. His goal is to use GIS on the front end where the map is the first thing the user sees. It is a forward looking approach and one that Schwartz hopes to spur others, like local elected officials, to use more often.
NKAPC had previously purchased software to track zoning and permitting applications and was storing the information in an INFORMIX database. But the organization still needed a reporting solution that would help extract information. Mike Schwartz of the NKAPC's Current Planning Department believed that using the planning commission's GIS technology would also be extremely beneficial. So the NKAPC turned to Information Builders Inc. (IBI) for its reporting solutions to allow the permitting data to be sent to constituent cities in the region through email blasts on a regular schedule. A consultant developed a dashboard within IBI's WEBFocus system and incorporated the GIS component (see figures 1 and 2) to see where permits were being issued, produce code enforcement reports, and determine where there might be code violations. "We have used ArcIMS for a number of years and so they (city administrators and staff) are accustomed to looking at maps but not with respect to permits," said Schwartz.
 |
 |
In the future, instead of having the map pop up at the end of the process, the NKAPC wants the ability to type an address and have the map show that location first; then click on the map to retrieve a dashboard with a series of tabs where each tab would be a different component of the data. Schwartz gave the example of frequent zoning changes. When a change occurs, he wants to drill down to get staff reports, city actions, development plans and anything related to that address. "Today's 100 acre farm is tomorrow's subdivision with 300 lots, 300 addresses and 300 property identification numbers. How do you take an address of today and find information about that area years from now where the only link to that data was the geometry?" said Schwartz. His goal is to use GIS on the front end where the map is the first thing the user sees. It is a forward looking approach and one that Schwartz hopes to spur others, like local elected officials, to use more often.
From Our Homepage
Saying Farewell to an Amazing Journey
Communicating with Maps
Is There a GIS Career Ladder?
What does it mean to be geospatially smart? Series
Ways Real Estate and Property Developers Utilize Melissa GeoData for Data-Driven Decisions
Unlocking Value From Daily Satellite Imagery and Insights
Maximizing the Value of Your Address Data with Geo Addressing
How Indoor Mapping Enhances the Security of Smart Buildings
Look Ahead: AI, Location Intelligence and Efficiency
Collaboration Takes on Sea Level Rise & Dynamic Technology Environments
Brownies for Brownfields
Has Everything Been Mapped Already?
How Is Data Literacy Changing in an Artificial Intelligence Landscape
Portfolios for GIS Professionals: More Than Just Maps
How to Create a Distance Matrix in QGIS - A Step-by-Step Guide
7 Ideas for Bringing GIS into the K-12 Classroom
The Geography of Movement