While GPS-integrated cellular phones and other
navigation systems are on the top of many American consumer shopping
lists this holiday season, service business owners have already made
inroads in the Location-based Services (LBS) market to enhance their
field service operations. In a recent survey conducted by the Aberdeen
Group (go to the end of this article for information on Aberdeen's
LBS survey methodology) in partnership with Directions Media (DM),
67% of DM respondents stated that they currently use some form of LBS,
such as Global Positioning Systems (GPS), Geographic Information
Systems (GIS) or Automatic Vehicle Location (AVL), to enhance their
field service operations. All of this is in response to only 14% of
polled respondents claiming high levels of satisfaction with their
field service operations.
In an environment of increased customer demand for better performance, rising commodity and operational costs, and shrinking product-based margins, field service inefficiencies can prove to be disastrous in terms of disgruntled customers and lost service revenue or profit opportunities. Therefore it is not surprising that 64% of respondents are looking to purchase and/or upgrade their technology arsenal to address both customer and business needs. Service business operators are actively using LBS and location intelligence to:
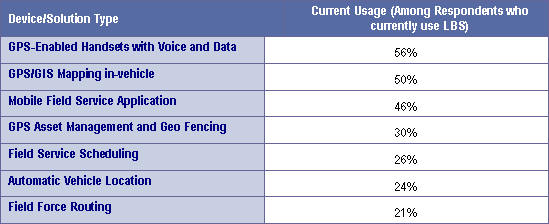
In terms of specific technology usage, a large portion of respondents currently equip their field staff with GPS-capable voice and data enabled handsets. GPS in-vehicle mapping devices are also a popular choice among field service organizations for their mapping and directions capabilities. To integrate these devices with back office systems there is also adoption and use of more robust mobile field service applications along with field service routing and scheduling applications.
Turn Right for Satisfied Customers
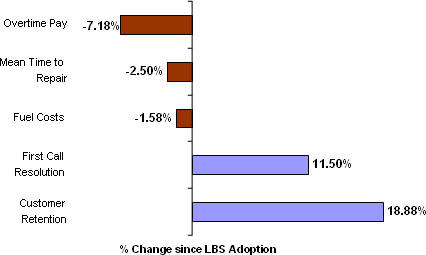
Location intelligence has helped service organizations see marked improvements in key metrics tracked by service organizations (figure 1). The data has also enabled these organizations to distance themselves from counterparts who are yet to take the LBS plunge (table 1).
Metrics used by the survey respondents track a wide array of both customer-facing and internal operational/financial measures. As such, the four most popular measures are i) customer satisfaction/retention, ii) daily work order completion, iii) service revenues/ profitability and iv) mean time to repair. LBS deployments have aided field service organizations in all of these capacities. In terms of customer retention, LBS users from the Directions readership have seen a near 19% jump since deployment. All of this stems from a near 12% boost in first call resolution and near 3% decrease in mean time to repair. Other benefits since LBS employment also point to a marked decrease in overall employee pay as well as a slight decrease in average fuel costs - a very topical metric given the recent instability in the commodities markets.
In comparison to companies that have yet to adopt location-based solutions, LBS users are seeing marked advantages in terms of work order completion rates, commute times and overall service margins. LBS users complete nearly an additional one-half work order per day per technician. The additional half work order completed daily per technician leveraged across the average respondent field workforce size of 40 technicians can amount to nearly 20 fully satisfied orders and customers on a daily basis - or 100 for a given work week. Part of this can be attributed to technicians who use LBS spending nearly five fewer minutes in their travel between work sites (per 60 minutes of work). From the DM readership, technicians at firms using LBS spend an average of 35 minutes traveling for every 60 minutes on the job compared to 39.2 minutes for non-LBS users.
The ultimate gauge of the value of the above mentioned enhancements can be seen in the bottom line where LBS users are seeing a near 300 basis point advantage in their service margins when compared to non-LBS users.
Integration Issues Pose LBS Barrier
With some of the enhancements seen above, 33% of the DM respondents still aren't sold on the value of LBS. The major objection stated against LBS is in the form of integration issues with current enterprise-wide back office systems stemming either from enterprise system complexity or from user inexperience with the new technology. Non-LBS users are also having a hard time garnering and concentrating the necessary IT resources to support LBS initiatives. Specific practices and strategies have been adopted by best-in-class firms to address these key objections.
Despite these challenges, this 33% of respondents is keenly observing the LBS landscape with the intent to purchase enhanced field service solutions with LBS capabilities in the next 24 months. In terms of devices, GPS-enabled handsets top the list, followed closely by GPS-enabled in-vehicle mapping devices. There are also intentions toward linking these devices with overall enabling mobile field service and specific routing and scheduling solutions.
Practices to Put Your Service Organization on the Map
Some of the best practices and strategies adopted to effectively leverage the full value of LBS address the following.
About Aberdeen's LBS in Mobile Field Service Survey
In October 2006, Aberdeen Group launched a survey to examine the mobile field service procedures, experiences and intentions, especially with regards to Location-based Services. The survey garnered 270 respondents over a two week period and all the data presented in Aberdeen's "Location. Location. Location. Does it Matter in Field Service? Benchmark Report" is a representation of the responses by the 270 survey participants.
Job title/function: The research sample included respondents with the following job titles: procurement, supply chain, field service, logistics executive or manager, 43%; C-level executive, 15%;field service, customer satisfaction, procurement, information technology director, 10%; senior/executive vice-president or vice-president, 9%.
Industry: The research sample included respondents from a range of industries/sectors such as, telecom/utilities, 19%; high-tech/medical manufacturing, 19%: construction, 13%; consumer facing industries, 13%; public sector/government, 10%; industrial manufacturing, 4%; aerospace and defense, 2%.
Geography: 70% of survey respondents were from North America. The remaining respondents were from EMEA, 18%; Asia Pacific region, 9%; South/Central America and the Caribbean, 3%.
Company size: About 14% of respondents were from large enterprises (annual revenues above US$1 billion); 29% were from midsize enterprises (annual revenues between $50 million and $1 billion); 57% of respondents were from small businesses (annual revenues of $50 million or less).
Field workforce size: About 34% of respondents were from enterprises with more than 100 field technicians; 14% were from those with field workforces between 25 and 100; and 52% of respondents were from smaller field workforces (less than 25 technicians).
In an environment of increased customer demand for better performance, rising commodity and operational costs, and shrinking product-based margins, field service inefficiencies can prove to be disastrous in terms of disgruntled customers and lost service revenue or profit opportunities. Therefore it is not surprising that 64% of respondents are looking to purchase and/or upgrade their technology arsenal to address both customer and business needs. Service business operators are actively using LBS and location intelligence to:
- Provide enhanced data for their routing/scheduling operations (70%*)
- Comply with regulatory requirements (35%*)
- Monitor asset vehicle health and performance (30%*)
- Resolve disputes with customers (25%*).
In terms of specific technology usage, a large portion of respondents currently equip their field staff with GPS-capable voice and data enabled handsets. GPS in-vehicle mapping devices are also a popular choice among field service organizations for their mapping and directions capabilities. To integrate these devices with back office systems there is also adoption and use of more robust mobile field service applications along with field service routing and scheduling applications.
Turn Right for Satisfied Customers
Location intelligence has helped service organizations see marked improvements in key metrics tracked by service organizations (figure 1). The data has also enabled these organizations to distance themselves from counterparts who are yet to take the LBS plunge (table 1).
 |
 |
Metrics used by the survey respondents track a wide array of both customer-facing and internal operational/financial measures. As such, the four most popular measures are i) customer satisfaction/retention, ii) daily work order completion, iii) service revenues/ profitability and iv) mean time to repair. LBS deployments have aided field service organizations in all of these capacities. In terms of customer retention, LBS users from the Directions readership have seen a near 19% jump since deployment. All of this stems from a near 12% boost in first call resolution and near 3% decrease in mean time to repair. Other benefits since LBS employment also point to a marked decrease in overall employee pay as well as a slight decrease in average fuel costs - a very topical metric given the recent instability in the commodities markets.
In comparison to companies that have yet to adopt location-based solutions, LBS users are seeing marked advantages in terms of work order completion rates, commute times and overall service margins. LBS users complete nearly an additional one-half work order per day per technician. The additional half work order completed daily per technician leveraged across the average respondent field workforce size of 40 technicians can amount to nearly 20 fully satisfied orders and customers on a daily basis - or 100 for a given work week. Part of this can be attributed to technicians who use LBS spending nearly five fewer minutes in their travel between work sites (per 60 minutes of work). From the DM readership, technicians at firms using LBS spend an average of 35 minutes traveling for every 60 minutes on the job compared to 39.2 minutes for non-LBS users.
The ultimate gauge of the value of the above mentioned enhancements can be seen in the bottom line where LBS users are seeing a near 300 basis point advantage in their service margins when compared to non-LBS users.
 |
Integration Issues Pose LBS Barrier
With some of the enhancements seen above, 33% of the DM respondents still aren't sold on the value of LBS. The major objection stated against LBS is in the form of integration issues with current enterprise-wide back office systems stemming either from enterprise system complexity or from user inexperience with the new technology. Non-LBS users are also having a hard time garnering and concentrating the necessary IT resources to support LBS initiatives. Specific practices and strategies have been adopted by best-in-class firms to address these key objections.
Despite these challenges, this 33% of respondents is keenly observing the LBS landscape with the intent to purchase enhanced field service solutions with LBS capabilities in the next 24 months. In terms of devices, GPS-enabled handsets top the list, followed closely by GPS-enabled in-vehicle mapping devices. There are also intentions toward linking these devices with overall enabling mobile field service and specific routing and scheduling solutions.
Practices to Put Your Service Organization on the Map
Some of the best practices and strategies adopted to effectively leverage the full value of LBS address the following.
'Breadcrumbing' is for LaggardsA complimentary copy (registration required) of the full Aberdeen report is available.
Nearly one-fourths of DM respondents (22%*) identify that they use LBS to monitor underperforming and non-compliant technicians. While improving employee compliance is a potential byproduct of LBS-enabled field service systems, it is only a component of the abilities that location intelligence can provide. Leveraging location data as actionable input for dispatching, scheduling and routing is how true operational and financial performance gains can be had.
What Gets Measured Gets Done
LBS data is worth very little if it isn't linked back to metrics to measure the true value of the investment. Best-in-class companies are equipping their senior executives with dashboards displaying the real-time performance of their service vehicle and worker performance while also tracking the direct effect on the end-user.
Don't Hound the Data
Location Intelligence can be of great value if shared within the entire organization. Not only does it help with customer satisfaction from a service point of view, but it can also enable other value chain components such as marketing, sales and product engineering to tweak their offerings to better match the customer needs. There is a great potential to tap these opportunities, as only 33% of respondents currently state that they systematically share enhanced point-of-service data with other teams within the organization.
A Senior Champion Will Pave the Way
Results show that LBS solutions have a positive effect on profitability - an easy sell to senior management. Forty-one percent of DM respondents indicate that they have no discrete management for the P&L in service operations. Having executive visibility into the value of LBS can be vital in garnering C-level and organization-wide support for LBS initiatives.
Where are the Parts?
Over the next 12 to 24 months, best-in-class service organizations will be evaluating and purchasing such solutions as RFID tags and integrated devices featuring mapping, voice, data and barcode scanning. The reason: these industry leaders are increasingly looking to coordinate the planning, provisioning and pricing of service parts and field service labor, as they aim to reduce parts-related delays and costs and enhance customer satisfaction and profitability
About Aberdeen's LBS in Mobile Field Service Survey
In October 2006, Aberdeen Group launched a survey to examine the mobile field service procedures, experiences and intentions, especially with regards to Location-based Services. The survey garnered 270 respondents over a two week period and all the data presented in Aberdeen's "Location. Location. Location. Does it Matter in Field Service? Benchmark Report" is a representation of the responses by the 270 survey participants.
Job title/function: The research sample included respondents with the following job titles: procurement, supply chain, field service, logistics executive or manager, 43%; C-level executive, 15%;field service, customer satisfaction, procurement, information technology director, 10%; senior/executive vice-president or vice-president, 9%.
Industry: The research sample included respondents from a range of industries/sectors such as, telecom/utilities, 19%; high-tech/medical manufacturing, 19%: construction, 13%; consumer facing industries, 13%; public sector/government, 10%; industrial manufacturing, 4%; aerospace and defense, 2%.
Geography: 70% of survey respondents were from North America. The remaining respondents were from EMEA, 18%; Asia Pacific region, 9%; South/Central America and the Caribbean, 3%.
Company size: About 14% of respondents were from large enterprises (annual revenues above US$1 billion); 29% were from midsize enterprises (annual revenues between $50 million and $1 billion); 57% of respondents were from small businesses (annual revenues of $50 million or less).
Field workforce size: About 34% of respondents were from enterprises with more than 100 field technicians; 14% were from those with field workforces between 25 and 100; and 52% of respondents were from smaller field workforces (less than 25 technicians).
From Our Homepage
Saying Farewell to an Amazing Journey
Communicating with Maps
Is There a GIS Career Ladder?
What does it mean to be geospatially smart? Series
Ways Real Estate and Property Developers Utilize Melissa GeoData for Data-Driven Decisions
Unlocking Value From Daily Satellite Imagery and Insights
Maximizing the Value of Your Address Data with Geo Addressing
How Indoor Mapping Enhances the Security of Smart Buildings
Look Ahead: AI, Location Intelligence and Efficiency
Collaboration Takes on Sea Level Rise & Dynamic Technology Environments
Brownies for Brownfields
Has Everything Been Mapped Already?
How Is Data Literacy Changing in an Artificial Intelligence Landscape
Portfolios for GIS Professionals: More Than Just Maps
How to Create a Distance Matrix in QGIS - A Step-by-Step Guide
7 Ideas for Bringing GIS into the K-12 Classroom
The Geography of Movement