Ed. note: This
article is the second in a series focus on inexpensive options. The
first appeared
on Oct. 18.
When you begin looking at "business geographics" systems, it can be somewhat confusing trying to match what you want to accomplish with what is available in the marketplace. According to legend, back in the early days of computing, Apple found that a new customer rarely bought his first computer from the nearest dealer. It took three visits to three different stores for the newcomer to learn enough of the language of computers to finally feel comfortable enough to commit to the purchase. This is very similar.
The commitment can be expensive, and not only do you need to learn the language, you probably also have to try out some of the techniques to get a clear picture of how this technology might apply to your particular set of business problems. If you are as frugal as I am, or have anybody in your budget approval chain of command who is, you are going to have to be sure you don't buy a dump truck to deliver a postage stamp.
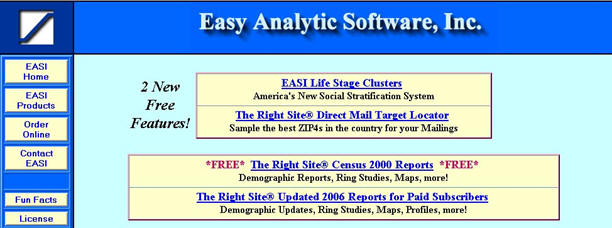
EASI Demographics' website offers a set of free tools you can try with a very low price tag: your email address. As far as I know, the company doesn't send you masses of email or otherwise bug you for trying the free functionality, so it's probably worth a try. You may get some literature in the mail, but it seems fairly risk-free. What I like is that you can make some maps and reports, learn a little bit on the way, and never have to be embarrassed about asking dumb questions. It's easy to find the free stuff on the site's homepage, as you'll see below.
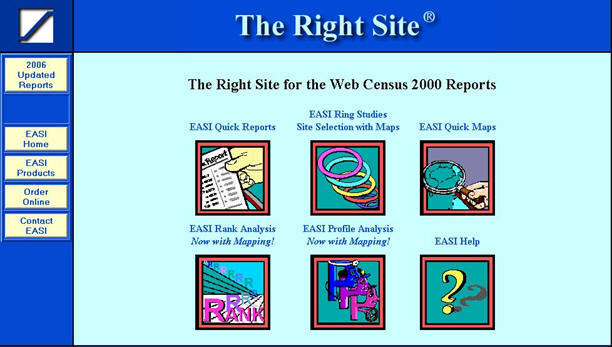
After you log in, you will see the screen below.
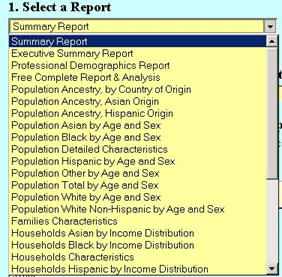
If you click on EASI Quick reports, you will go to this dialog.
In this case I picked the Summary Report (the default report) and I selected my ZIP Code and state. You can select from a whole range of reports and geographies.
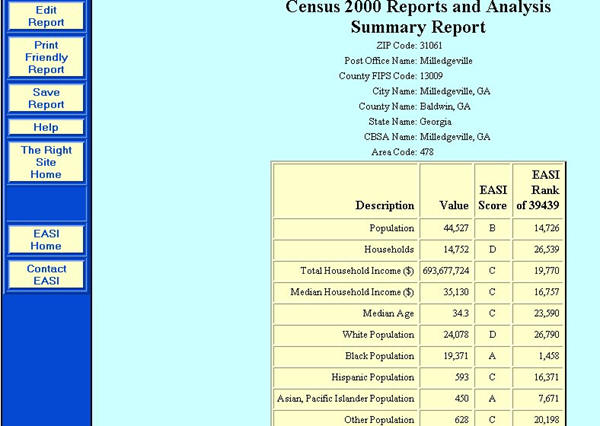
Below is the report that I created. Note on the left side you can select Print Friendly Report, which formats the report for your printer.
You can map demographics in this free section, and perform ring studies. Since this is a free resource, it won't give you thematic rings, but it will show you the value of each ring in a report. And on the map, it will show you a simple representation of each ring. When you select the Ring Study from the opening user interface, it takes you to this dialog.
Follow the steps on the left, one of which involves capturing a latitude/longitude. The logic of this process is that it takes you to the map and lets you verify that the address the EASI geocoder found is actually the location of your point of interest. Then, clicking on Create Site Study (step #7), you will get a report that looks like this.
Note that a column for each ring contains a set of variables and the totals for each.
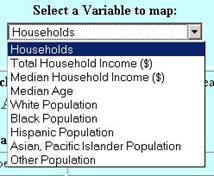
At the top left is a button called Site Study Map; click that and you will see the variable choices for the map and options for how you want your map to look.
The colorful A, B, C, etc. lets you select the ranges (A = the highest, E = the lowest). The ranges are quintiles. You can display labels for the geography and data, and select the variable to map in the pull-down box. Because this is a free site, you don't have as much control over the map as you would in software for which you actually paid. But you do get to see the data and gain a perspective of how the values are distributed within the selected geography.
At the bottom of this dialog is a button for Create Map. This produces the map based on what you have selected.
The colored squares represent the high to low values of that variable. Note that you can zoom and change size of the map display. If you select the larger map sizes, you will see streets, highways and some landmarks. By clicking on the edges of the map, you can pan side-to-side or up and down.
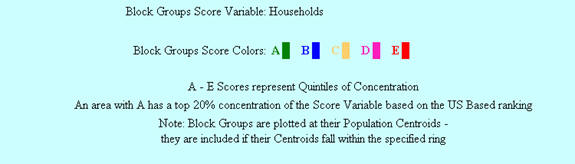
In the dialog below (which is actually at the bottom of the screen above), you can see the block group scores for the map. In this case they are represented by quintiles of concentration.
You can do more on the EASI site. You can rank geographies, edit the maps you have made, make maps that show demographic values in other geographies besides ZIP Codes and, in the case above, look at values at the block group level.
Something else to check out while you are on the EASI site are the Fun Facts. Here you will find more information about the fastest growing geographies in the country. This might be a preview of your next target marketing effort.
The EASI site is a good way to get into business geographics without buying software and data. It will give you an idea of how the basics work with no risk, and it lets you try before you buy. The EASI data will work with almost any mapping program, should you decide to become a more serious business geographer down the road.
When you begin looking at "business geographics" systems, it can be somewhat confusing trying to match what you want to accomplish with what is available in the marketplace. According to legend, back in the early days of computing, Apple found that a new customer rarely bought his first computer from the nearest dealer. It took three visits to three different stores for the newcomer to learn enough of the language of computers to finally feel comfortable enough to commit to the purchase. This is very similar.
The commitment can be expensive, and not only do you need to learn the language, you probably also have to try out some of the techniques to get a clear picture of how this technology might apply to your particular set of business problems. If you are as frugal as I am, or have anybody in your budget approval chain of command who is, you are going to have to be sure you don't buy a dump truck to deliver a postage stamp.
EASI Demographics' website offers a set of free tools you can try with a very low price tag: your email address. As far as I know, the company doesn't send you masses of email or otherwise bug you for trying the free functionality, so it's probably worth a try. You may get some literature in the mail, but it seems fairly risk-free. What I like is that you can make some maps and reports, learn a little bit on the way, and never have to be embarrassed about asking dumb questions. It's easy to find the free stuff on the site's homepage, as you'll see below.
 |
After you log in, you will see the screen below.
 |
If you click on EASI Quick reports, you will go to this dialog.
 |
In this case I picked the Summary Report (the default report) and I selected my ZIP Code and state. You can select from a whole range of reports and geographies.
 |
Below is the report that I created. Note on the left side you can select Print Friendly Report, which formats the report for your printer.
 |
You can map demographics in this free section, and perform ring studies. Since this is a free resource, it won't give you thematic rings, but it will show you the value of each ring in a report. And on the map, it will show you a simple representation of each ring. When you select the Ring Study from the opening user interface, it takes you to this dialog.
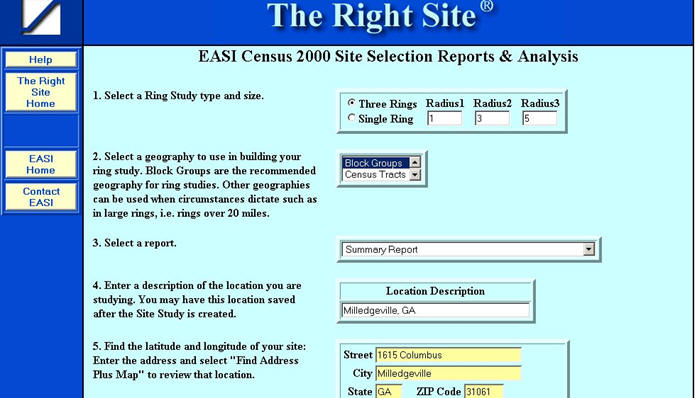 |
Follow the steps on the left, one of which involves capturing a latitude/longitude. The logic of this process is that it takes you to the map and lets you verify that the address the EASI geocoder found is actually the location of your point of interest. Then, clicking on Create Site Study (step #7), you will get a report that looks like this.
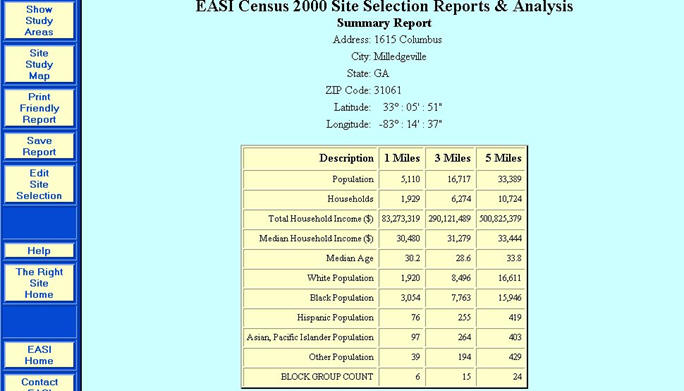 |
Note that a column for each ring contains a set of variables and the totals for each.
At the top left is a button called Site Study Map; click that and you will see the variable choices for the map and options for how you want your map to look.
|
The colorful A, B, C, etc. lets you select the ranges (A = the highest, E = the lowest). The ranges are quintiles. You can display labels for the geography and data, and select the variable to map in the pull-down box. Because this is a free site, you don't have as much control over the map as you would in software for which you actually paid. But you do get to see the data and gain a perspective of how the values are distributed within the selected geography.
 |
At the bottom of this dialog is a button for Create Map. This produces the map based on what you have selected.
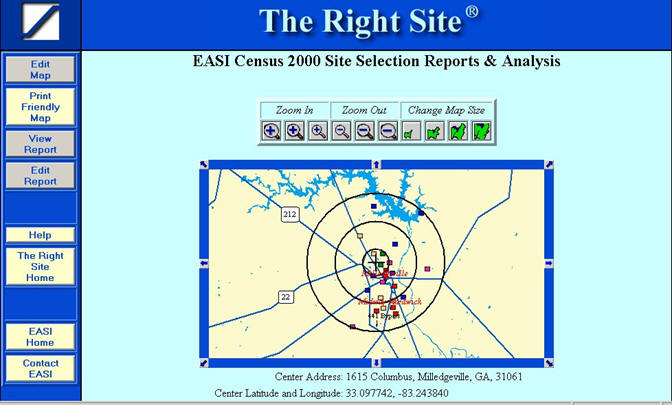 |
The colored squares represent the high to low values of that variable. Note that you can zoom and change size of the map display. If you select the larger map sizes, you will see streets, highways and some landmarks. By clicking on the edges of the map, you can pan side-to-side or up and down.
In the dialog below (which is actually at the bottom of the screen above), you can see the block group scores for the map. In this case they are represented by quintiles of concentration.
 |
You can do more on the EASI site. You can rank geographies, edit the maps you have made, make maps that show demographic values in other geographies besides ZIP Codes and, in the case above, look at values at the block group level.
Something else to check out while you are on the EASI site are the Fun Facts. Here you will find more information about the fastest growing geographies in the country. This might be a preview of your next target marketing effort.
The EASI site is a good way to get into business geographics without buying software and data. It will give you an idea of how the basics work with no risk, and it lets you try before you buy. The EASI data will work with almost any mapping program, should you decide to become a more serious business geographer down the road.
From Our Homepage
Saying Farewell to an Amazing Journey
Communicating with Maps
Is There a GIS Career Ladder?
What does it mean to be geospatially smart? Series
Ways Real Estate and Property Developers Utilize Melissa GeoData for Data-Driven Decisions
Unlocking Value From Daily Satellite Imagery and Insights
Maximizing the Value of Your Address Data with Geo Addressing
How Indoor Mapping Enhances the Security of Smart Buildings
Look Ahead: AI, Location Intelligence and Efficiency
Collaboration Takes on Sea Level Rise & Dynamic Technology Environments
Brownies for Brownfields
Has Everything Been Mapped Already?
How Is Data Literacy Changing in an Artificial Intelligence Landscape
Portfolios for GIS Professionals: More Than Just Maps
How to Create a Distance Matrix in QGIS - A Step-by-Step Guide
7 Ideas for Bringing GIS into the K-12 Classroom
The Geography of Movement