Nora Parker (NP): Thank you so much for talking to Directions Magazine this morning.
Mateo Bartoli (MB): It's my pleasure.
NP: What is your role at NAVTEQ?
MB: I am Product Manager in charge of data that goes into our databases, especially the in-vehicle navigation databases.
NP: What was the impetus behind adding this information to NAVTEQ's in-vehicle navigation map data?
MB: We are constantly working on improving the look and feel of our in-vehicle navigation data. In this case, we wanted to provide information that would not only provide a better looking map, but would also provide information that would be helpful in navigation.For example, in the winter, it would be helpful to know that your trip will involve going up a mountain, and then you can know at what elevation you will need to deal with snow.Also, in the past, you might have looked at your map and seen a big blank area [an area with no cities, for example] and not realize that it was blank [uninhabited] because it was the side of a mountain.So we wanted to add this information to improve not only the visual aspect of the database, but also make it more helpful to the driver.It really helps drivers orient themselves during their trip.
NP: And so what would the driver actually see on the screen?
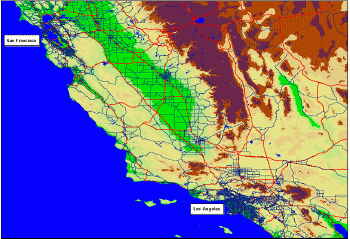
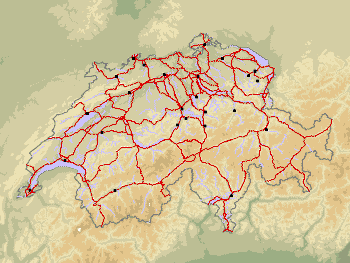
MB: It would be shaded elevation contours as a backdrop to the roads.These contours are generated using some very sophisticated GIS modeling capabilities.It's a process of taking the gridded digital elevation model data and turning it into contours, which are displayed on the map.It looks a lot like the maps you see on long haul airplane trips.


Click image for larger
view of the examples.The western US coastline and inland between San Francisco
and Los Angeles (left) and Switzerland (right).
NP: Is that in-vehicle navigation database of use to GIS users? Is the actual elevation data included in the database?
MB: Yes, we believe we will see our GIS customers using the data.It's a separate layer of data, and GIS customers will use it the same way -- as a backdrop to improve the visualization of the data.We started releasing the data in Q1, and so far the feedback has been very positive.
NP: Are there other upcoming enhancements that we could let our readers know about?
MB: Well, I can say that we are always planning and working on additional enhancements, but there aren't any that I am at liberty to describe at this point.But yes, we are always working on adding more data that will help drivers.
NP: Is there anything else we should know at this point about the data?
MB: Well, yes, it's
really thanks to GIS technology that your readers work in that allows us
to generate this data and offer it to drivers.And I would like your readers
to know that.