I evaluate computer-based educational activities with a single question: Do I want to play with it? I’m happy to report that after spending 45 minutes watching and listening to Robert Cheetham, CEO of Azavea, “drive” the Model My Watershed simulation, I wanted to take the mouse out of his hand and play!
I wanted to change land cover and add green roofs to buildings to try to jumpstart the local economy by 15%, cut runoff by 30% and increase water quality by 20%. That’s exactly what the simulation enables students to do. Geographers will love the simulation since it’s built on real mapping data (from USGS NLCD, USGS NED, USGS NRCS soils, USGS NHD watersheds and streams, EPA Environmental Justice areas and Azavea's Cicero database among others) and uses real hydrologic models (a combination of TR-55 and the Pitt Model developed by hydrology consultants). The only aspect of the simulation that’s “made up” is the exact details of how the student’s changes to a geography (upgrading a developed area to a wetland, for example) will really impact the economy, runoff and water quality, as well as how much it would cost. The changes send impacts in the right direction (more wetlands mean less runoff) but the values are not tuned to the real world.
The Wiki Watershed Project
Azavea is one of many partners working with the Stroud Water Research Center on a National Science Foundation-funded project on watersheds. Model My Watershed will be one of many tools at the Center’s under-development Wiki Watershed site.
Model My Watershed will deliver a watershed-modeling tool set for secondary students based on Google Maps and open source software. The students will be able to:
- Modify both environmental conditions and model parameters
- Work in a collaborative online learning environment
- Be exposed to STEM [science, technology, education and math] careers
Interactive Learning Tools
During development, the geography area of interest is southeastern Pennsylvania. Cheetham gave me a tour of some of the educational tools; others are still under development. The vision is that traditional lectures, textbooks and videos will complement online, interactive teaching aids. Cheetham showed off one that introduces the key ideas of the daily water budget.
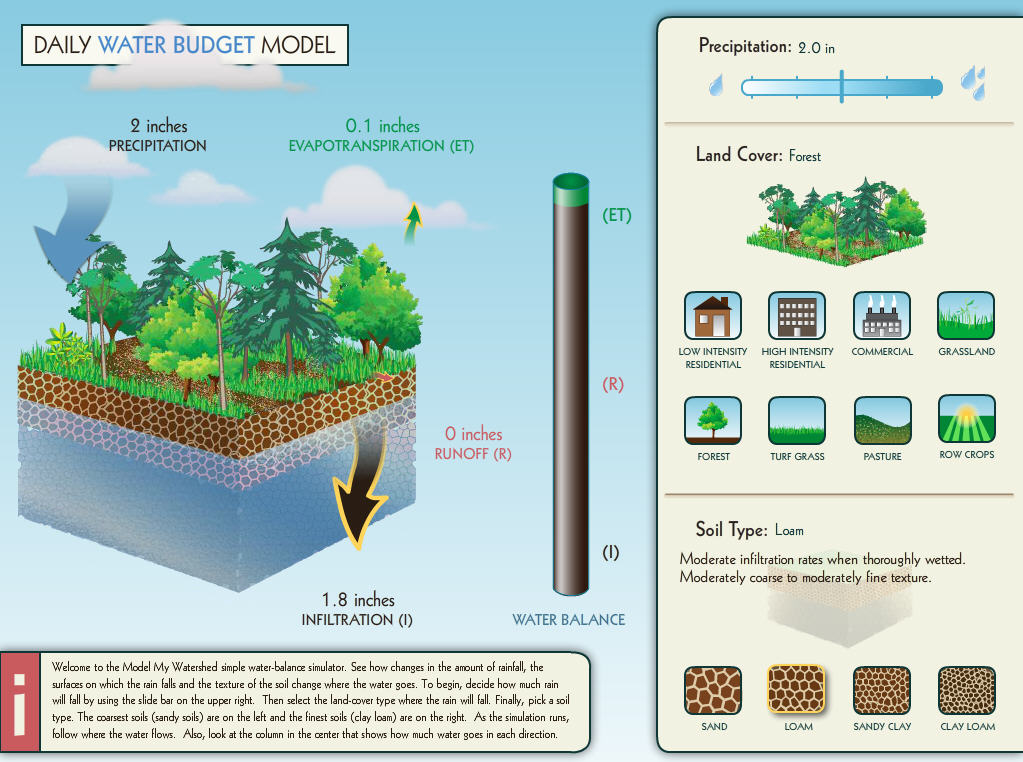
Caption: This interactive teaching aid helps students understand the daily water balance. They can adjust how much rain falls, on what type of land use and on which what type of soil.
With two inches of precipitation on forested land, .1 inch is released back in to the atmosphere via evapotranspiration, none runs off and 1.9 inches are absorbed into the land via infiltration. What if there were eight inches of precipitation? The evapotranspiration would be the same, but .4 would runoff and 7.5 inches would infiltrate. What if you change the land cover from forest to row crops or high intensity residential? And, what if you change the underlying soil type from sand to loam?
While students think through why different amounts of precipitation, different kinds of land cover and different soil types change the ratios, they are also learning the vocabulary, icons and symbols they’ll use when working with the Model My Watershed interface.
Exploring Real Watersheds
Students can start their explorations of real watershed data via the Show My Watershed app. First they can define an area of interest: sub-basin, watershed, sub-watershed or an area defined by a polygon. Then the fun begins. The Flowpoint tool allows a student to click on a point and find all the areas that send water to it. Once all the pixels that send water to the point are identified, those pixels are coded based on their land use. The result is a thematic map of land cover types of the pixels that contribute water. Students can also get tabular details on the elevation of the area of interest and the soil types represented by percentage. Students can, since this is built on Google maps, look at the satellite images or terrain (contour map) data for the area from Google.
Students can now explore the water budget of the area of interest. It works similarly to the teaching aid described above, but now on actual southeastern Pennsylvania geography. There’s another twist; there are two columns of evapotranspiration, runoff and infiltration data. One is for the area before Columbus’ time (Pre Columbian) and one is “now.” With more built up areas, most of southeastern Pennsylvania has far more runoff than several hundred years ago.
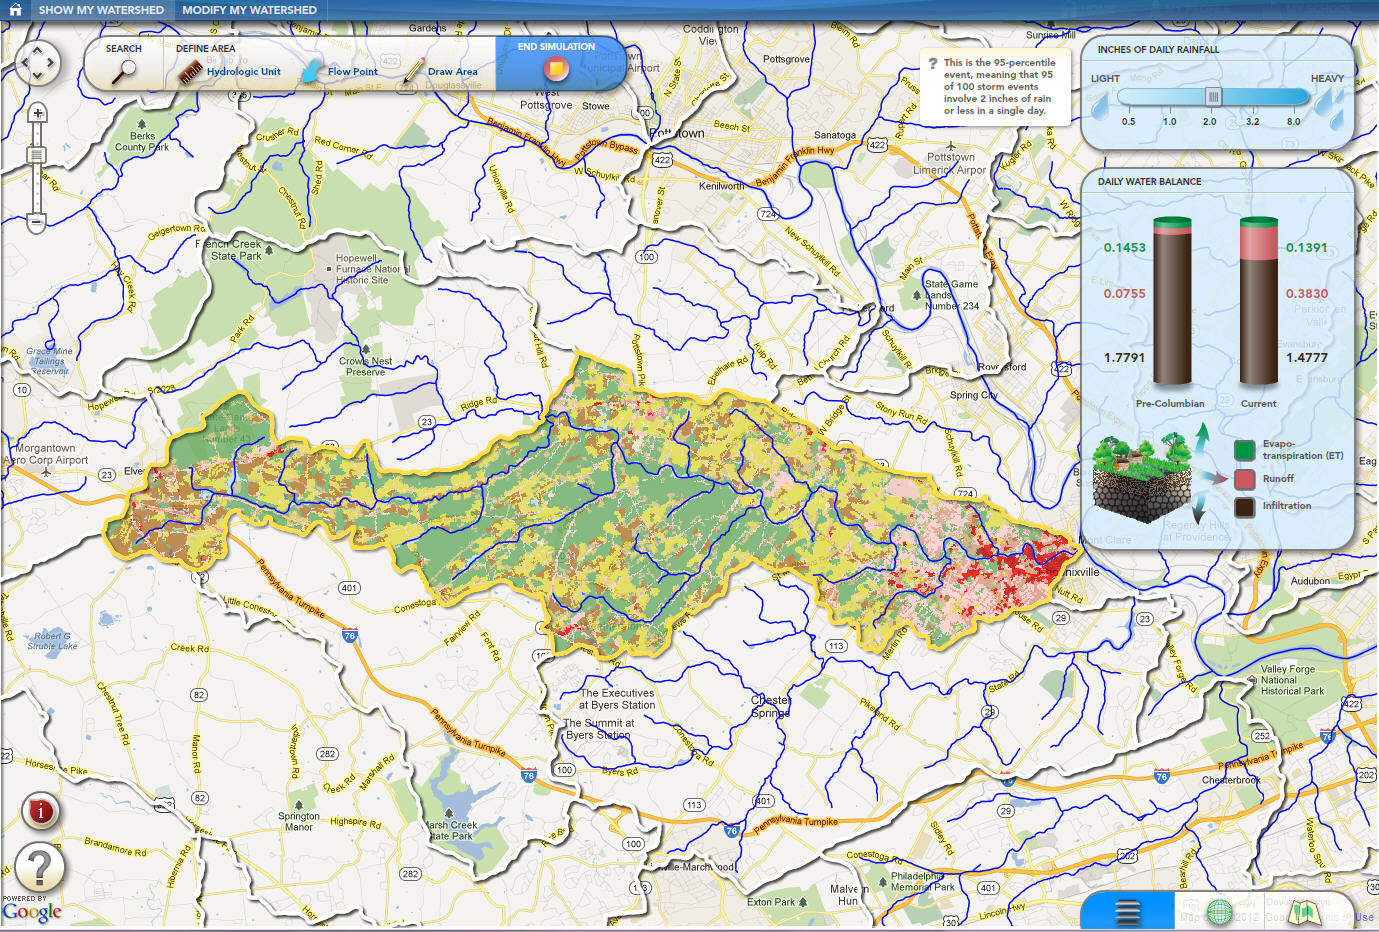
Caption: When students explore the water budget for southeastern Pennsylvania they can compare the situation today with what existed before Columbus’ time.
Modeling My Watershed
The best part of the simulation is the Modify My Watershed app, which is not yet publicly available. In this app the teacher would ideally set an area of interest such as the local watershed, town or school campus. The teacher would also set goals for students to meet related to economic growth, run off and water quality. Students would be assigned a budget to spend which would dip as money is spent by adjusting a variety of parameters to try to reach the goal. Students might change land cover or implement practices such as installing green roofs or using rain barrels. Based on what they’ve learned so far, students decide what to do and how to try to meet the goals without going over budget.
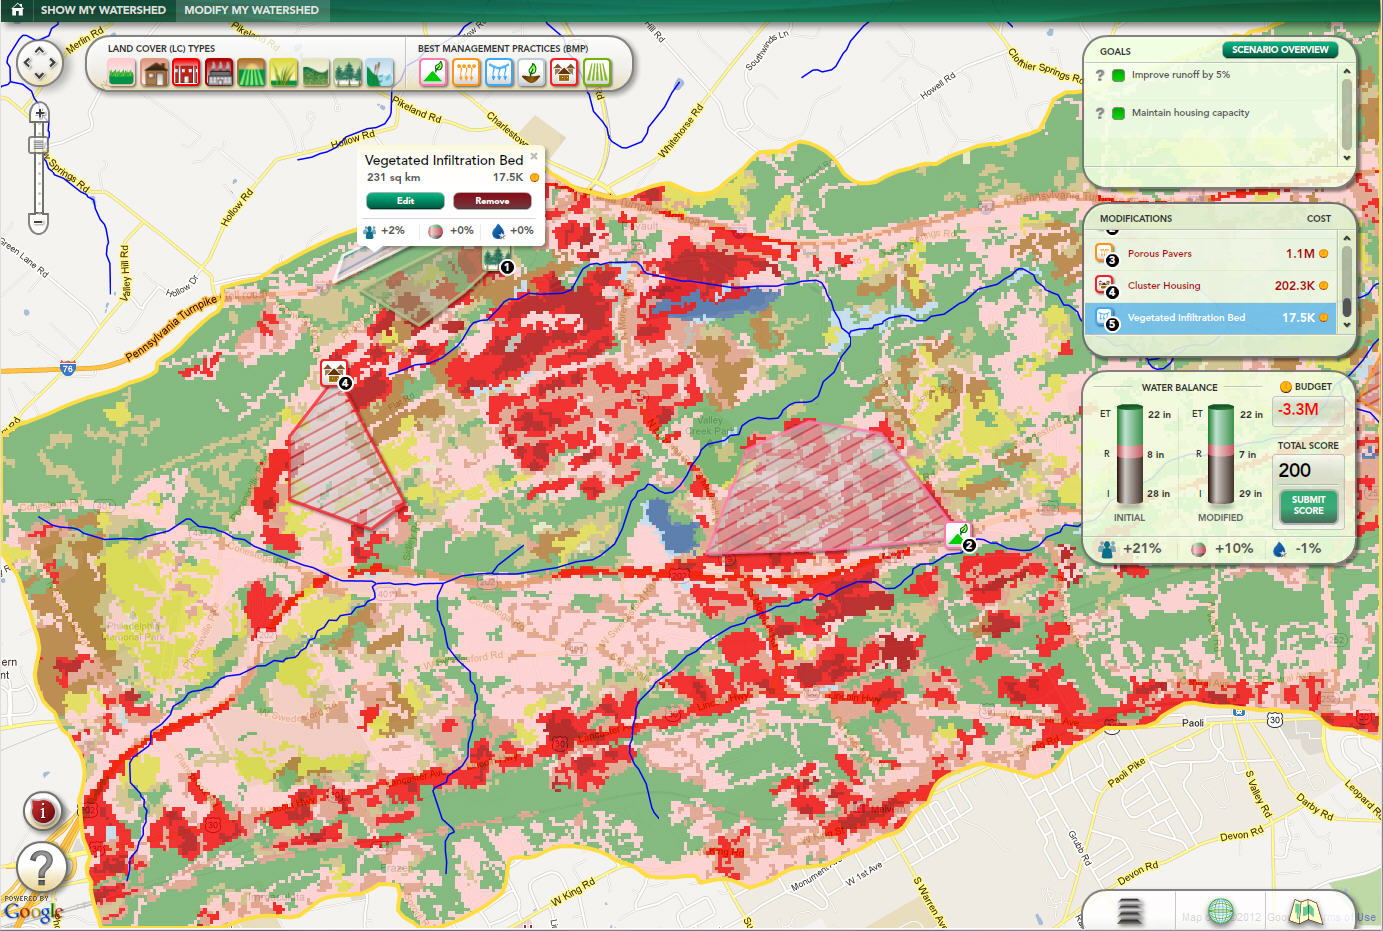
The interface students will use to make changes to the area of interest to try to meet economic and environmental goals
The Road Ahead
To date, Stroud and Azavea have worked with hydrologists to build some new water models, with educators to enhance the interface design, and with teachers to provide feedback on what they need to make such a tool successful. One of the requirements for the tools is real-time response. Educators know that students will become distracted if the results of changing a parameter are not instantaneous. How do the backend models work so fast? Azavea is using its GeoTrellis open source project to break up the process and return answers fast.
What’s ahead? Cheetham expects to see the public rollout in late summer. At that time teachers will have access to the tools needed for in-class use. The long-term plan includes expanding the tools to cover the entire United States, moving the app from Flash to HTML5, and working to make modeling the urban environment’s water cycle more accurate.
Now, be honest, don’t you want to play with these apps?