The
market penetration of the vast commercial real estate industry by GIS
companies has been quite small to date - even though real estate and
GIS are both all about "location, location, location." Real estate
technology consultant Gil Castle examines the reasons behind that poor
performance and strategies for substantial improvement. Included in the
analysis are examples of two specific business opportunities. [Note
that "GIS" as used here encompasses LBS, neo-geography and other facets
of spatial technologies.]
Market Size
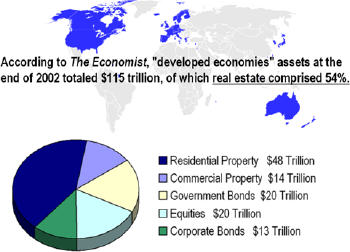
Real estate is a far larger industry than most people realize. As documented in Exhibit 1, the total value of real estate holdings in the developed world in fact exceeds the combined value of all publically traded stocks, corporate bonds and government bonds.
Commercial real estate alone was valued at $14 trillion even back in 2002.
Lest there is any lingering doubt about the importance of real estate, think about the economic impacts of "subprime mortgages"!
Customer Segment
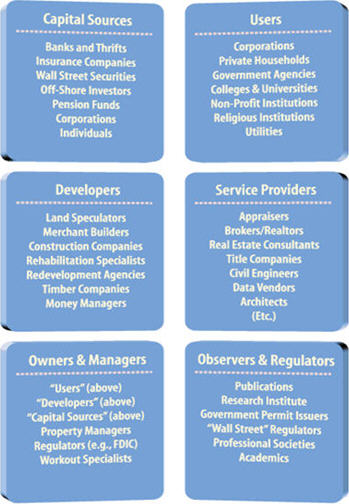
The segments comprising the industry are both numerous and highly diverse. Each of the 50 segments in Exhibit 2 has its own distinct product needs.
GIS companies have had limited market penetration except among a few, small niches such as institutional investment advisors. GIS companies have been able to sell enterprise systems to the largest companies in each segment - but those customers comprise a minuscule portion of the entire market.
Unlike a government agency that can acquire an enterprise license and mandate that everyone in its "segment" use that GIS system, the acquisition of GIS systems by a few large real state companies has no bearing on the vast number of smaller companies in its segment.
A new GIS business model is needed to achieve any significant increase in sales to the commercial real estate industry.
Marketing Strategies
GIS vendors have generally been missing the highest revenue opportunities in the real estate industry, as described in this section.
Vendors generally view selling a generic product as preferable to a customized product because of the greater number of potential customers; for example, selling Excel generates more revenue than selling an income tax spreadsheet template. Moreover, selling one generic product is seen as preferable to selling many customized products, because the cost of product development and ongoing customer support is lower for one product than for many. Not surprisingly, then, GIS companies prefer to offer a small number of generic products and few, if any, customized products.
On the one hand... the more focused and easier-to-use a GIS product is, the greater the number of likely customers - as depicted in Exhibit 3. Examples of Simple products with millions of users are GIS-based real estate listing and pricing websites, including www.zillow.com and www.trulia.com for residential real estate and www.loopnet.com for commercial properties. A prime example of a Complex product with correspondingly far fewer users is Archibus.
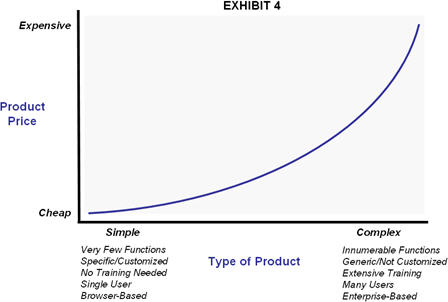
On the other hand... the more sophisticated and comprehensive the product, the greater the price that can be charged, as illustrated in Exhibit 4. Simple products like Zillow, Trulia and Loopnet range from being free to costing at most a few hundred dollars annually. At the other end of the curve, the annual licensing fees for Archibus and other Complex products are in the thousands of dollars per seat.
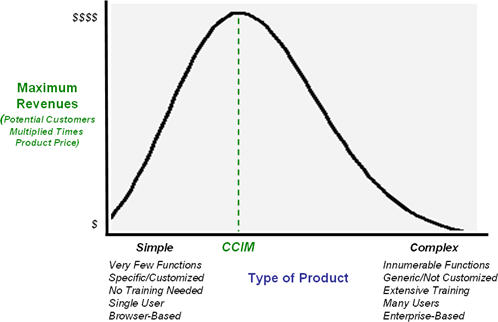
Revenues are maximized by combining Exhibits 3 and 4. That is, for each point on the "Type of Product" x-axis, multiplying the "Potential Customers" times the "Product Price" equals the potential revenues for that point, resulting in the quasi-bell curve in Exhibit 5. The highest point of the curve is where a company can achieve maximum revenues. As shown, this point occurs somewhere between a Simple and Complex product offering. For example, a thousand customers, each paying $1,000, results in far more revenue than a hundred customers, each paying $5,000. (The CCIM reference in Exhibit 5 will be explained shortly.)
Successfully Marketing GIS Products and Services
Overcoming the Obstacles
The principal obstacle to market penetration has been the requirement that GIS products be customized to each of the many real estate industry segments. Even when enterprise systems have been sold to leading real estate companies - CB Richard Ellis, Jones Lang LaSalle, etc. - those companies have then customized the software in-house to their specific needs. Very few companies in each segment are both large enough and technologically interested enough to develop a customized enterprise GIS for their employees. Third-party developers have not bridged the gap by building customized apps. Hence, without a change in the business model, only a tiny percentage of the companies in each segment are likely to become customers.
Evidence of how successful an alternative GIS business model can be is found in CCIM's Site to Do Business. CCIM is a professional association for commercial brokers that contracted for a customized GIS that its members could easily use - both technically and financially. Now thousands of brokers, who would not on their own have become GIS customers, are using the customized online GIS. As illustrated previously in Exhibit 5, the CCIM product is at the "sweet spot" of a not-too-complicated product at a relatively low price; the resulting high volume of users translates into impressive revenues.
The real estate industry demands customized products, but (for the reasons cited earlier) GIS companies are antipathetic toward customization. How can the conflict be resolved, in order to tap this huge market?
A number of strategies are available. For example:
Opportunities Matrix
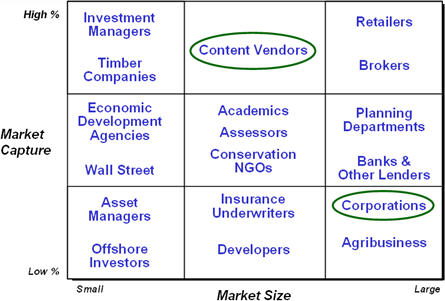
Castle Consulting's "opportunities matrix" in Exhibit 6 arrays real estate GIS customers on the basis of (a) technology adoption to date, versus (b) the potential number of customers. Customer segments in the upper left corner (Investment Managers and Timber Companies) have a high adoption rate but are relatively few in number. Segments in the lower right corner (Corporations and Agribusiness) encompass tens of thousands of potential customers, but so far show a low adoption rate. Segments in the upper right corner - the financial sweet spot - are both relatively numerous and have a high adoption rate; a great many Retailers and Brokers use GIS, yet even in this corner the GIS market is far from saturated.
Case Study: Content Vendors
Maximizing sales requires providing content that not only will be of interest to the greatest number of industry players, but also is not readily available from other sources. These twin objectives can be accomplished with a number of strategies, three of which are delineated below.
One strategy is to provide a standardized data set that everyone wants. In residential real estate, assessor parcels are an excellent example. In commercial real estate, the long sought Holy Grail is submarket boundaries. These are used to report vacancy rates, asking rents, total inventory of space, and other metrics that everyone involved in real estate needs. The major purveyors of real estate information all have their own submarket boundaries (to differentiate their products), thereby making apples-to-apples comparisons very tedious.
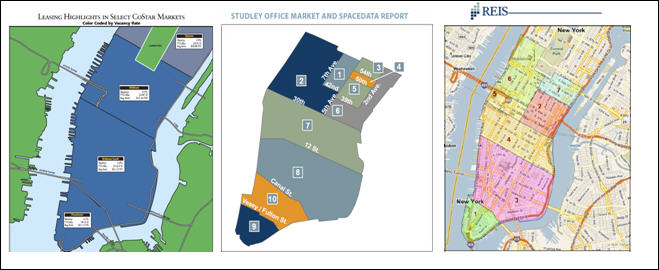
For example, in Exhibit 7 are the Manhattan office submarket boundaries of three of the nation's leading real estate information companies (see www.costar.com, www.studley.com, and www.reisreports.com). Not only do the boundaries of the submarkets vary, but so do the number of submarkets. Even though all three companies provide the same types of information (historical and forecast figures on total inventory of commercial space, asking rents, vacancy rates and so on), consumers of this information cannot readily combine and compare the different data sets.
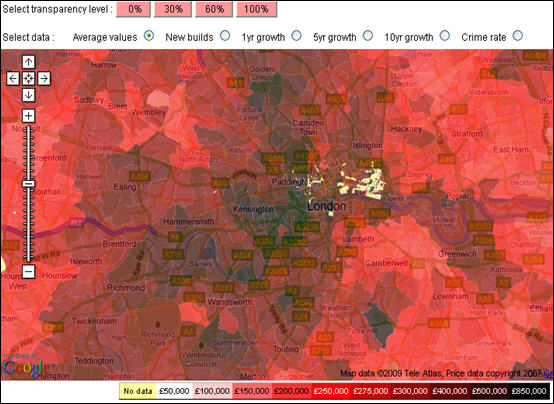
A second strategy is to provide proprietary, periodically updated real estate data that a broad spectrum of individuals and institutions want to see, in a compelling, interactive format. Ideally the displayed information should encompass the salient variables in real estate financial models (again, vacancy rates, etc.) as well as other contributing factors (demand-side variables such as daytime population, risk factors such as earthquake zones, and so on). Historic and current data are good - and forecast maps are even better. Exhibit 8 is a residential real estate "heat map" example for the London metropolitan area; note the interactive formatting options.
A third strategy is to integrate innumerable types of information, more so than anyone else, paying special attention to new and rapidly evolving sources and formats. Exhibit 9 provides the innumerable additions to traditional "data layers" worth considering in real estate decision making.
Real estate is essentially a game of information arbitrage; that is, whoever knows the most about a property has the best chance of maximizing profits. GIS is the best technology invented yet for bringing together all available data pertinent to a specific location.
Case Study:Corporate Real Estate (CRE)
CRE refers to the real estate holdings of companies that are not generally considered to be in the real estate business. The vast majority of companies in the developed world are in this category. For example, of the 30 companies comprising the Dow Jones Industrial Average (AT&T, Coca-Cola, ExxonMobil, IBM, etc.), only one might be considered a real estate company - MacDonald's. (Arguably MacDonald's is not itself in the business of selling hamburgers, but rather is in the business of buying and leasing promising sites to franchisees; it's the franchisees who are in the hamburger business.)
A few noteworthy statistics:
How can GIS be profitably applied? As the business adage goes, "You can't manage what you don't measure." Among the many CRE applications that arise, here are two that are based on using GIS to keep track of rising/falling real estate prices wherever a company owns or leases properties:
The Bottom Line
Sooner or later all real estate professionals will be using GIS technology. Though the industry has traditionally been somewhat technophobic, the competitive advantage gained by pace-setting GIS users will ultimately compel everyone else to embrace GIS as well. Now is an excellent time for providers of GIS products and services to focus on the commercial real estate industry, both to contribute to, and benefit from, the inevitable arrival of the "tipping point."
Market Size
Real estate is a far larger industry than most people realize. As documented in Exhibit 1, the total value of real estate holdings in the developed world in fact exceeds the combined value of all publically traded stocks, corporate bonds and government bonds.
 |
Commercial real estate alone was valued at $14 trillion even back in 2002.
Lest there is any lingering doubt about the importance of real estate, think about the economic impacts of "subprime mortgages"!
Customer Segment
The segments comprising the industry are both numerous and highly diverse. Each of the 50 segments in Exhibit 2 has its own distinct product needs.
 |
GIS companies have had limited market penetration except among a few, small niches such as institutional investment advisors. GIS companies have been able to sell enterprise systems to the largest companies in each segment - but those customers comprise a minuscule portion of the entire market.
Unlike a government agency that can acquire an enterprise license and mandate that everyone in its "segment" use that GIS system, the acquisition of GIS systems by a few large real state companies has no bearing on the vast number of smaller companies in its segment.
A new GIS business model is needed to achieve any significant increase in sales to the commercial real estate industry.
Marketing Strategies
GIS vendors have generally been missing the highest revenue opportunities in the real estate industry, as described in this section.
Vendors generally view selling a generic product as preferable to a customized product because of the greater number of potential customers; for example, selling Excel generates more revenue than selling an income tax spreadsheet template. Moreover, selling one generic product is seen as preferable to selling many customized products, because the cost of product development and ongoing customer support is lower for one product than for many. Not surprisingly, then, GIS companies prefer to offer a small number of generic products and few, if any, customized products.
On the one hand... the more focused and easier-to-use a GIS product is, the greater the number of likely customers - as depicted in Exhibit 3. Examples of Simple products with millions of users are GIS-based real estate listing and pricing websites, including www.zillow.com and www.trulia.com for residential real estate and www.loopnet.com for commercial properties. A prime example of a Complex product with correspondingly far fewer users is Archibus.
 |
On the other hand... the more sophisticated and comprehensive the product, the greater the price that can be charged, as illustrated in Exhibit 4. Simple products like Zillow, Trulia and Loopnet range from being free to costing at most a few hundred dollars annually. At the other end of the curve, the annual licensing fees for Archibus and other Complex products are in the thousands of dollars per seat.
 |
Revenues are maximized by combining Exhibits 3 and 4. That is, for each point on the "Type of Product" x-axis, multiplying the "Potential Customers" times the "Product Price" equals the potential revenues for that point, resulting in the quasi-bell curve in Exhibit 5. The highest point of the curve is where a company can achieve maximum revenues. As shown, this point occurs somewhere between a Simple and Complex product offering. For example, a thousand customers, each paying $1,000, results in far more revenue than a hundred customers, each paying $5,000. (The CCIM reference in Exhibit 5 will be explained shortly.)
 |
Successfully Marketing GIS Products and Services
Overcoming the Obstacles
The principal obstacle to market penetration has been the requirement that GIS products be customized to each of the many real estate industry segments. Even when enterprise systems have been sold to leading real estate companies - CB Richard Ellis, Jones Lang LaSalle, etc. - those companies have then customized the software in-house to their specific needs. Very few companies in each segment are both large enough and technologically interested enough to develop a customized enterprise GIS for their employees. Third-party developers have not bridged the gap by building customized apps. Hence, without a change in the business model, only a tiny percentage of the companies in each segment are likely to become customers.
Evidence of how successful an alternative GIS business model can be is found in CCIM's Site to Do Business. CCIM is a professional association for commercial brokers that contracted for a customized GIS that its members could easily use - both technically and financially. Now thousands of brokers, who would not on their own have become GIS customers, are using the customized online GIS. As illustrated previously in Exhibit 5, the CCIM product is at the "sweet spot" of a not-too-complicated product at a relatively low price; the resulting high volume of users translates into impressive revenues.
The real estate industry demands customized products, but (for the reasons cited earlier) GIS companies are antipathetic toward customization. How can the conflict be resolved, in order to tap this huge market?
A number of strategies are available. For example:
- Speak Their Language. The simplest (though not the
most lucrative) approach would be to prepare much better targeted,
segment-specific brochures, conference presentations, webinars and
other marketing materials, in order to at least capture the small
number of companies in each segment that may be inclined to acquire GIS
products. These materials must explicitly reference the tasks, models,
even vocabulary of each segment (e.g., "asking rents, discounted cash
flow, net operating income," rather than "points, lines, polygons").
For example, here's a link to a GIS Planning client
testimonial which explicitly cites return on investment (ROI):.
- Train Third-Party Developers. GIS companies would like to sell their generic products to third-party developers and let them build the customized applications for the real estate industry. This has not worked well, at least in part because few third-party developers are sufficiently skilled simultaneously in both GIS and real estate, much less in how to be a successful entrepreneur. A GIS company could facilitate workshops, however, in which third-party developers (for a fee) would be given a crash course on various real estate industry segments, what customized products those segments want, how best to market to each segment, etc.
- Cherry-Pick Customization Opportunities. A GIS company need not provide customized products to all the real estate industry segments. Instead, all the segments could be screened on the basis of how much a customized solution would cost; how many copies of that solution could be licensed at various price points; what subsequent, add-on sales might become possible (e.g., new data sets each year), and so on. The GIS company could then decide which one, two or three customized products would be well worth the investment. In this regard, see the "opportunities matrix" in the next section and sample case studies thereafter.
- Find the Overlaps. Certain software and data combinations could be assembled that would appeal to multiple segments. For example, a number of companies developed GIS tools and databases for retailers to use in trade area analyses, and then marketed those same tools and databases to brokers (both commercial and residential), banks (for compliance with anti-red lining regulations), and so on; among the notables are Nielsen Claritas, Alteryx (formerly SRC), geoVue, Tactician, Pitney Bowes Business Insight and ESRI. The key is to determine which industry segments have essentially the same underlying GIS analysis needs, even though used for very different purposes.
- Create an Entirely New Product. If the stakes are high enough, rolling out an entirely new offering could be very attractive. For example, SuperGeo offers a hand-held GIS for identifying and appraising properties. On a far larger scale, in the mid-1990s Dow Jones and other partners created TELERES to provide a single national source of comprehensive on-line real estate information and analysis, designed to effectively standardize the process for the trading, securitizing and valuing of commercial real estate. TELERES failed due to a combination of technical reasons and the onset of a recession, but the concept remains sound - essentially a GIS-driven Bloomberg for real estate data.
Opportunities Matrix
Castle Consulting's "opportunities matrix" in Exhibit 6 arrays real estate GIS customers on the basis of (a) technology adoption to date, versus (b) the potential number of customers. Customer segments in the upper left corner (Investment Managers and Timber Companies) have a high adoption rate but are relatively few in number. Segments in the lower right corner (Corporations and Agribusiness) encompass tens of thousands of potential customers, but so far show a low adoption rate. Segments in the upper right corner - the financial sweet spot - are both relatively numerous and have a high adoption rate; a great many Retailers and Brokers use GIS, yet even in this corner the GIS market is far from saturated.
 |
Case Study: Content Vendors
Maximizing sales requires providing content that not only will be of interest to the greatest number of industry players, but also is not readily available from other sources. These twin objectives can be accomplished with a number of strategies, three of which are delineated below.
One strategy is to provide a standardized data set that everyone wants. In residential real estate, assessor parcels are an excellent example. In commercial real estate, the long sought Holy Grail is submarket boundaries. These are used to report vacancy rates, asking rents, total inventory of space, and other metrics that everyone involved in real estate needs. The major purveyors of real estate information all have their own submarket boundaries (to differentiate their products), thereby making apples-to-apples comparisons very tedious.
For example, in Exhibit 7 are the Manhattan office submarket boundaries of three of the nation's leading real estate information companies (see www.costar.com, www.studley.com, and www.reisreports.com). Not only do the boundaries of the submarkets vary, but so do the number of submarkets. Even though all three companies provide the same types of information (historical and forecast figures on total inventory of commercial space, asking rents, vacancy rates and so on), consumers of this information cannot readily combine and compare the different data sets.
 |
A second strategy is to provide proprietary, periodically updated real estate data that a broad spectrum of individuals and institutions want to see, in a compelling, interactive format. Ideally the displayed information should encompass the salient variables in real estate financial models (again, vacancy rates, etc.) as well as other contributing factors (demand-side variables such as daytime population, risk factors such as earthquake zones, and so on). Historic and current data are good - and forecast maps are even better. Exhibit 8 is a residential real estate "heat map" example for the London metropolitan area; note the interactive formatting options.
 |
A third strategy is to integrate innumerable types of information, more so than anyone else, paying special attention to new and rapidly evolving sources and formats. Exhibit 9 provides the innumerable additions to traditional "data layers" worth considering in real estate decision making.
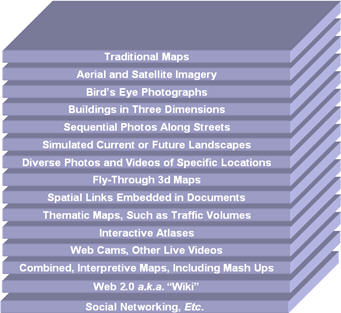 |
Real estate is essentially a game of information arbitrage; that is, whoever knows the most about a property has the best chance of maximizing profits. GIS is the best technology invented yet for bringing together all available data pertinent to a specific location.
Case Study:Corporate Real Estate (CRE)
CRE refers to the real estate holdings of companies that are not generally considered to be in the real estate business. The vast majority of companies in the developed world are in this category. For example, of the 30 companies comprising the Dow Jones Industrial Average (AT&T, Coca-Cola, ExxonMobil, IBM, etc.), only one might be considered a real estate company - MacDonald's. (Arguably MacDonald's is not itself in the business of selling hamburgers, but rather is in the business of buying and leasing promising sites to franchisees; it's the franchisees who are in the hamburger business.)
A few noteworthy statistics:
- Corporations account for about 75% of the capital going into commercial real estate (i.e., three-fourths of the previously cited $14 trillion).
- Real estate holdings on average comprise 25% of a corporation's assets on its balance sheet.
- Real estate expenditures are typically a corporation's second largest operating expense (payroll being the largest).
- On average a corporation's real estate expenditures are two times its net earnings.
How can GIS be profitably applied? As the business adage goes, "You can't manage what you don't measure." Among the many CRE applications that arise, here are two that are based on using GIS to keep track of rising/falling real estate prices wherever a company owns or leases properties:
- If a company owns the buildings in which it operates its business, and those properties are in a market where comparable properties are declining in value and are projected to continue declining, the company should consider doing a sale-and-leaseback. The company could thereby continue to operate its business in its current space but not have its balance sheet dragged down by a weak real estate market. The reverse is of course also true; if a company is renting space in a market that will have escalating prices, the company should consider buying the buildings it occupies and directly benefit from property appreciation rates.
- If comparable property prices are falling, a company may be able to convince the county assessor that its property taxes should be lowered. Given that many assessors now use some form of GIS for determining annual assessments, a company may even find that all the data it needs to appeal a property tax assessment are readily available from the assessor.
The Bottom Line
Sooner or later all real estate professionals will be using GIS technology. Though the industry has traditionally been somewhat technophobic, the competitive advantage gained by pace-setting GIS users will ultimately compel everyone else to embrace GIS as well. Now is an excellent time for providers of GIS products and services to focus on the commercial real estate industry, both to contribute to, and benefit from, the inevitable arrival of the "tipping point."
From Our Homepage
Saying Farewell to an Amazing Journey
Communicating with Maps
Is There a GIS Career Ladder?
What does it mean to be geospatially smart? Series
Ways Real Estate and Property Developers Utilize Melissa GeoData for Data-Driven Decisions
Unlocking Value From Daily Satellite Imagery and Insights
Maximizing the Value of Your Address Data with Geo Addressing
How Indoor Mapping Enhances the Security of Smart Buildings
Look Ahead: AI, Location Intelligence and Efficiency
Collaboration Takes on Sea Level Rise & Dynamic Technology Environments
Brownies for Brownfields
Has Everything Been Mapped Already?
How Is Data Literacy Changing in an Artificial Intelligence Landscape
Portfolios for GIS Professionals: More Than Just Maps
How to Create a Distance Matrix in QGIS - A Step-by-Step Guide
7 Ideas for Bringing GIS into the K-12 Classroom
The Geography of Movement