In this two-part article, I will examine why spatial
analysis provides a valuable capability to traditional Business
Intelligence (BI) solutions. I will also discuss measurements to
categorize solutions that provide spatial analysis to BI platforms from
the perspective of solution capability and system longevity.
Part One focuses on the value of combining these two previously
separate disciplines. It will also attempt to make clear the relevance
of BI to GIS users. Part two (which will appear next week) will discuss
some important considerations when approaching the integration of BI
and GIS, and how to evaluate solutions in this space.
Growth for GIS
One of the next great growth areas for GIS will be into the world of BI, now merged into what is being called Corporate or Business Performance Management (CPM or BPM). The ability to combine BI with spatial analysis in real-time has been something of a nirvana, but today it is well within reach.
The Value Proposition
What is the value of spatial representations in a BI environment? Is the ability to color code states or ZIP Codes really enough? The question that BI users are asking is what does the addition of a spatial representation give me that I cannot already do? How much extra value is there in showing a map of color coded states as opposed to a bar chart showing the same data?
There is, of course, value in seeing how the sales figures for one state (for example) compare with those of other states. That's where GIS starts to hold its own. The value is even more pronounced when you consider displaying data by ZIP Code or by other factors related to proximity that are not easily visualized in non-spatial presentation formats.
To maximize the value of combining GIS with BI, any drill-downs or filters applied in the BI tool need to be automatically reflected in the spatial representation and, conversely, spatial filters must be applied in the BI tool.
It is important for the GIS community to realize that the map is not the application. It is just a part of the solution. From a business user's perspective, the map is just another chart. Even though it might be the most comprehensive chart in the arsenal, it is still just a part of the solution. Think of how Napoleon's fine cavalry fared at the Battle of Waterloo without their infantry support. Anybody remember the Charge of the Light Brigade? How would the Indianapolis Colts do if they played both halves of the game using just their offensive line-up?
Having said that, I think we are doing GIS a disservice by declaring its power to be in color coding ZIP Codes or even displaying themed point data. After all, this is where GIS was many years ago. The real power starts to become apparent when more advanced spatial visualizations are closely coupled with BI and other external data. Specialized GIS representations, such as contoured hot spots or demographic analysis based on drive times, add a new dimension to BI that had previously been out of reach.
Case Study
The manager of a large service center suspects customers are being poached by competitors on the other side of town. She wants to understand more about where her customers are coming from and what factors are affecting their habits. She discovers that a lack of local services may be attracting customers to a competitor.
What are the high value areas in which she could get better customer satisfaction or catchment by providing local services? Conversely, where is she exposed to a competitor providing more local services and taking her customers?
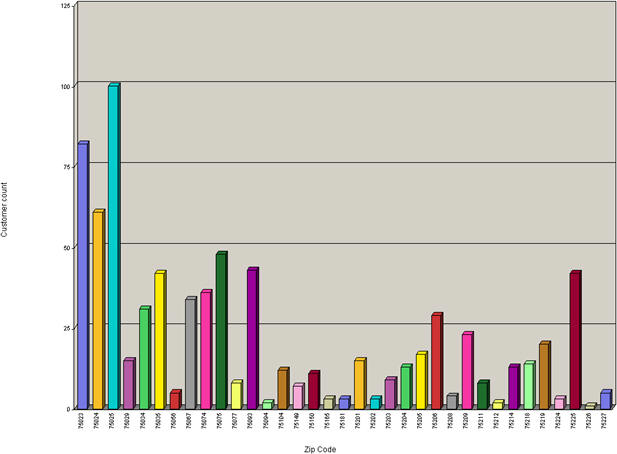
In a traditional BI environment, you can show the number of customers who travel to use a service by comparing the service consumption location with the customer's home or work place. This could allow you to plot a bar chart system (see figure 1) for numbers of customers who travel to use the service.
This may seem straightforward, but trying to show ï¿1⁄2source to
destinationï¿1⁄2 using this method provides too many permutations for a
typical BI visualization to sensibly deliver. A separate bar would need
to be displayed for every source/destination combination. Also, this
chart does not reveal distances traveled or whether, for example, the
service is available on the way home or on the way to work.
The customer might access a service in a ZIP Code that is different from his residential ZIP Code, but is, in reality, just a stroll away from his home address. Traditional BI systems are not good at visualizing this type of situation.
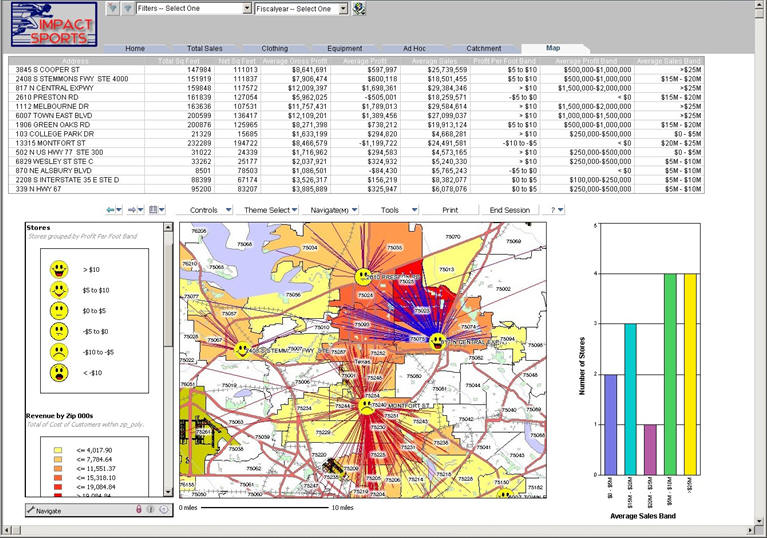
However, from a GIS perspective, this is relatively straightforward if
the right visualizations are used (see figure 2). A single glance can
show catchment areas against location and distance for multiple service
outlets.
Simply seeing the customers who are in danger of defection does not
reveal the value or history of these customers in a way that can be
readily analyzed (see figure 3). This is the forte of the BI platforms:
they are set up to develop applications that focus on particular data
sets quickly and provide comprehensive non-spatial analysis out of the
box.
To augment this analysis, our service center manager could then plot the location of her competitors' service locations on the above map to get a lie of the competitive landscape. The use of demographic and drive time analysis can further refine the analysis to give a clear picture of actual and potential customer numbers against inconvenience or competitive pull. All of this can then be easily analyzed in the BI tool to create impact analysis scenarios.
Again, one of the key points of value is the ability to select data from the spatial representation and cause the BI representations to filter on or drill down to that data set. Beyond that, you can use the spatial criteria to source new data from an external data source and then provide those data seamlessly back to the BI representation, where they can be used for combined display. For example, you can show services against demographic catchment, or a more calculated analysis, such as customer penetration for specific demographics taking into account the drain from nearby competitors. In building an application like this, the BI user base expects to have a comprehensive, rapid application development environment that does not require code to be written and delivers targeted, robust, enterprise deployable applications.
The spatial world lags far behind in this respect and it is a shock to BI users to discover they are expected to write code or XML or set up complex external services to provide what is for them just another chart. To be really accepted in their environment, the spatial representation must be configured in much the same way as their BI representations and provided within their application building environment.
It is also crucial that the spatial representation be displayed and manipulated within the BI runtime environment to provide side by side comparisons and data filtering. This provides the user with the confidence that the data being displayed are the same and are synchronized between representations. Hopefully this helps depict why the sum of the parts can provide a solution that can be many magnitudes more powerful than the parts of the sum.
The Parts of the Sum
Each solution domain brings distinct benefits to the combined solution.
Business Intelligence
A typical BI platform will bring the ability to comprehensively analyze non-spatial attributes in data. Interactive charting, data pivots, computed items, drilling down and filtering are all out of the box. Building applications is usually a 100% drag and drop exercise with no code required. Depending on the platform, you can either connect directly to any database and drag data items into your application data model, or build and use an abstraction layer that provides a standardized view of your corporate data.
Reports can be delivered in a number of formats, such as HTML fixed or ad-hoc reports, or email bursts of Excel or pdf output. The rising star in BI report delivery is the dashboard. Dashboards are no longer tools for the CEO and CFO only. The latest BI platforms make comprehensive interactive dashboards available to all employees. Users can start by looking at their Key Performance Indicators (KPIs) and then drill or filter down to as much detail as is required to investigate a situation or trend. They can then make a well-informed business decision. The BI platforms allow fast application development delivering targeted applications that meet user needs.
For the major BI platforms, centrally managed security is also a given. Administrators can easily create ï¿1⁄2rolesï¿1⁄2 and ï¿1⁄2groupsï¿1⁄2 to define who has access to what portals and reports. They can control who can view, interact or edit reports and how reports are published to these users. They can control which data are accessible within a report, down to different users accessing the same report but seeing data access controlled at the row level. Most importantly, the BI platforms are widely accepted by users as the one-stop-shop for access to business data. More and more, spatial analysis is expected to be a part of this picture.
Geographic Information Systems
Today's GIS systems offer a smorgasbord of spatial analysis functions and visualizations. How to conduct spatial analysis is no longer a mystery - ranging from demographic catchment areas to slope or gas cloud dispersion analysis. It is a mature domain providing powerful analysis of spatial correlations, a stable delivery environment for map images and unique spatial visualizations.
Much of this capability is quite specialized, but more and more is becoming relevant within the context of business analysis. The GIS vendors have gone down the road of providing either vertical solutions targeted at very specific user groups, or have provided servers that allow programmers to create custom applications that harness Web-based functionality. This leads to a great base for Web 2.0 or Software as a Service (SaaS)-type applications, but places the onus for application logic, security and presentation on the client.
Where BI platforms have attempted to include spatial functionality without integration with a GIS platform, the results have frequently been inferior to what could have been achieved. Of course GIS does not provide the non-spatial analysis capabilities available in a BI platform, so an analytic application built using spatial platforms must still be augmented with Business Intelligence-type capabilities. It can be a big wheel to reinvent.
Software as a Service (SaaS)
The emerging interest in the consumption of SaaS provides another interesting aspect to the whole scene. Will it be possible to provide either BI or spatial analysis or both as SaaS? There are already examples of companies that host their BI and GIS environments in separate remote sites but still provide a fully integrated performance management solution. What are the dynamics in terms of data transfer and location that would allow a real SaaS solution to exist in this space? This is a topic to be explored in another article.
Writing on the Wall
More and more companies are coming to realize that without a comprehensive integrated spatial analysis component to their BI solution, they are flying blind in some aspects. Depending on the type of industry, the benefit can range from minor to essential.
In the second part of this article I will look at why solutions should be measured for corporate/government suitability, and at some measurements and justifications for this. The article will be published next week.
Growth for GIS
One of the next great growth areas for GIS will be into the world of BI, now merged into what is being called Corporate or Business Performance Management (CPM or BPM). The ability to combine BI with spatial analysis in real-time has been something of a nirvana, but today it is well within reach.
The Value Proposition
What is the value of spatial representations in a BI environment? Is the ability to color code states or ZIP Codes really enough? The question that BI users are asking is what does the addition of a spatial representation give me that I cannot already do? How much extra value is there in showing a map of color coded states as opposed to a bar chart showing the same data?
There is, of course, value in seeing how the sales figures for one state (for example) compare with those of other states. That's where GIS starts to hold its own. The value is even more pronounced when you consider displaying data by ZIP Code or by other factors related to proximity that are not easily visualized in non-spatial presentation formats.
To maximize the value of combining GIS with BI, any drill-downs or filters applied in the BI tool need to be automatically reflected in the spatial representation and, conversely, spatial filters must be applied in the BI tool.
It is important for the GIS community to realize that the map is not the application. It is just a part of the solution. From a business user's perspective, the map is just another chart. Even though it might be the most comprehensive chart in the arsenal, it is still just a part of the solution. Think of how Napoleon's fine cavalry fared at the Battle of Waterloo without their infantry support. Anybody remember the Charge of the Light Brigade? How would the Indianapolis Colts do if they played both halves of the game using just their offensive line-up?
Having said that, I think we are doing GIS a disservice by declaring its power to be in color coding ZIP Codes or even displaying themed point data. After all, this is where GIS was many years ago. The real power starts to become apparent when more advanced spatial visualizations are closely coupled with BI and other external data. Specialized GIS representations, such as contoured hot spots or demographic analysis based on drive times, add a new dimension to BI that had previously been out of reach.
Case Study
The manager of a large service center suspects customers are being poached by competitors on the other side of town. She wants to understand more about where her customers are coming from and what factors are affecting their habits. She discovers that a lack of local services may be attracting customers to a competitor.
What are the high value areas in which she could get better customer satisfaction or catchment by providing local services? Conversely, where is she exposed to a competitor providing more local services and taking her customers?
In a traditional BI environment, you can show the number of customers who travel to use a service by comparing the service consumption location with the customer's home or work place. This could allow you to plot a bar chart system (see figure 1) for numbers of customers who travel to use the service.
 |
The customer might access a service in a ZIP Code that is different from his residential ZIP Code, but is, in reality, just a stroll away from his home address. Traditional BI systems are not good at visualizing this type of situation.
 |
 |
To augment this analysis, our service center manager could then plot the location of her competitors' service locations on the above map to get a lie of the competitive landscape. The use of demographic and drive time analysis can further refine the analysis to give a clear picture of actual and potential customer numbers against inconvenience or competitive pull. All of this can then be easily analyzed in the BI tool to create impact analysis scenarios.
Again, one of the key points of value is the ability to select data from the spatial representation and cause the BI representations to filter on or drill down to that data set. Beyond that, you can use the spatial criteria to source new data from an external data source and then provide those data seamlessly back to the BI representation, where they can be used for combined display. For example, you can show services against demographic catchment, or a more calculated analysis, such as customer penetration for specific demographics taking into account the drain from nearby competitors. In building an application like this, the BI user base expects to have a comprehensive, rapid application development environment that does not require code to be written and delivers targeted, robust, enterprise deployable applications.
The spatial world lags far behind in this respect and it is a shock to BI users to discover they are expected to write code or XML or set up complex external services to provide what is for them just another chart. To be really accepted in their environment, the spatial representation must be configured in much the same way as their BI representations and provided within their application building environment.
It is also crucial that the spatial representation be displayed and manipulated within the BI runtime environment to provide side by side comparisons and data filtering. This provides the user with the confidence that the data being displayed are the same and are synchronized between representations. Hopefully this helps depict why the sum of the parts can provide a solution that can be many magnitudes more powerful than the parts of the sum.
The Parts of the Sum
Each solution domain brings distinct benefits to the combined solution.
Business Intelligence
A typical BI platform will bring the ability to comprehensively analyze non-spatial attributes in data. Interactive charting, data pivots, computed items, drilling down and filtering are all out of the box. Building applications is usually a 100% drag and drop exercise with no code required. Depending on the platform, you can either connect directly to any database and drag data items into your application data model, or build and use an abstraction layer that provides a standardized view of your corporate data.
Reports can be delivered in a number of formats, such as HTML fixed or ad-hoc reports, or email bursts of Excel or pdf output. The rising star in BI report delivery is the dashboard. Dashboards are no longer tools for the CEO and CFO only. The latest BI platforms make comprehensive interactive dashboards available to all employees. Users can start by looking at their Key Performance Indicators (KPIs) and then drill or filter down to as much detail as is required to investigate a situation or trend. They can then make a well-informed business decision. The BI platforms allow fast application development delivering targeted applications that meet user needs.
For the major BI platforms, centrally managed security is also a given. Administrators can easily create ï¿1⁄2rolesï¿1⁄2 and ï¿1⁄2groupsï¿1⁄2 to define who has access to what portals and reports. They can control who can view, interact or edit reports and how reports are published to these users. They can control which data are accessible within a report, down to different users accessing the same report but seeing data access controlled at the row level. Most importantly, the BI platforms are widely accepted by users as the one-stop-shop for access to business data. More and more, spatial analysis is expected to be a part of this picture.
Geographic Information Systems
Today's GIS systems offer a smorgasbord of spatial analysis functions and visualizations. How to conduct spatial analysis is no longer a mystery - ranging from demographic catchment areas to slope or gas cloud dispersion analysis. It is a mature domain providing powerful analysis of spatial correlations, a stable delivery environment for map images and unique spatial visualizations.
Much of this capability is quite specialized, but more and more is becoming relevant within the context of business analysis. The GIS vendors have gone down the road of providing either vertical solutions targeted at very specific user groups, or have provided servers that allow programmers to create custom applications that harness Web-based functionality. This leads to a great base for Web 2.0 or Software as a Service (SaaS)-type applications, but places the onus for application logic, security and presentation on the client.
Where BI platforms have attempted to include spatial functionality without integration with a GIS platform, the results have frequently been inferior to what could have been achieved. Of course GIS does not provide the non-spatial analysis capabilities available in a BI platform, so an analytic application built using spatial platforms must still be augmented with Business Intelligence-type capabilities. It can be a big wheel to reinvent.
Software as a Service (SaaS)
The emerging interest in the consumption of SaaS provides another interesting aspect to the whole scene. Will it be possible to provide either BI or spatial analysis or both as SaaS? There are already examples of companies that host their BI and GIS environments in separate remote sites but still provide a fully integrated performance management solution. What are the dynamics in terms of data transfer and location that would allow a real SaaS solution to exist in this space? This is a topic to be explored in another article.
Writing on the Wall
More and more companies are coming to realize that without a comprehensive integrated spatial analysis component to their BI solution, they are flying blind in some aspects. Depending on the type of industry, the benefit can range from minor to essential.
In the second part of this article I will look at why solutions should be measured for corporate/government suitability, and at some measurements and justifications for this. The article will be published next week.
From Our Homepage
Saying Farewell to an Amazing Journey
Communicating with Maps
Is There a GIS Career Ladder?
What does it mean to be geospatially smart? Series
Ways Real Estate and Property Developers Utilize Melissa GeoData for Data-Driven Decisions
Unlocking Value From Daily Satellite Imagery and Insights
Maximizing the Value of Your Address Data with Geo Addressing
How Indoor Mapping Enhances the Security of Smart Buildings
Look Ahead: AI, Location Intelligence and Efficiency
Collaboration Takes on Sea Level Rise & Dynamic Technology Environments
Brownies for Brownfields
Has Everything Been Mapped Already?
How Is Data Literacy Changing in an Artificial Intelligence Landscape
Portfolios for GIS Professionals: More Than Just Maps
How to Create a Distance Matrix in QGIS - A Step-by-Step Guide
7 Ideas for Bringing GIS into the K-12 Classroom
The Geography of Movement