In part
one of this article, I looked at the case for the provision of
spatial analysis to Business Intelligence (BI) platforms. In this
second part I will examine how solutions in this space can be
classified and why it is important to evaluate them for corporate
suitability and solution longevity. This is especially important for
larger organizations such as government departments or large
corporations.
The Players
Within the space that encompasses BI and spatial analysis, there are three types of players. First are the BI vendors, who have been concentrating on moving their offerings to pure Web delivery platforms. While some are better than others in this regard, they all offer the same type of solution. Senior BI executives have indicated that the next wave of differentiation is going to be in the area of mobile devices and spatial analysis.
Second are the GIS vendors, who are in a perilous position because the next great expansion for them is into the BI heartland. Since the main controllers and presentation mechanisms in this domain are the BI tools, the GIS vendors are in danger of being relegated to just another display platform similar to the way databases are used transparently by BI technology today.
In the middle are the integrators, who have perceived the need for these two industries to unite to finally provide a more unified solution.
The Integration Platform
Although still a relatively new domain, a tiered-type classification of solutions is emerging from integrators providing spatial solutions to BI platforms.
These begin with the idea that all that is required is a simple data transfer bridge. As understanding matures, there is the realization that a more complete platform is required, one that manages data flow, controls the application logic and provides the required visualizations back to the BI tool. This platform also allows the user to break the tight coupling between one BI tool and one GIS platform. It allows organizations to select best of breed or even mix and match at the BI and GIS levels. The following table provides a description of the different levels of integration that are possible.
To quantify what could be important about these tiers, letï¿1⁄2s look at them from the perspectives of corporate suitability and solution longevity. For corporate suitability, look at cost of ownership, ability to handle differing user needs, extensibility and ease of building and use.
From the solution longevity perspective, look at the longer term resilience to platform change. This is largely based on clean separation between the parts of the solution.
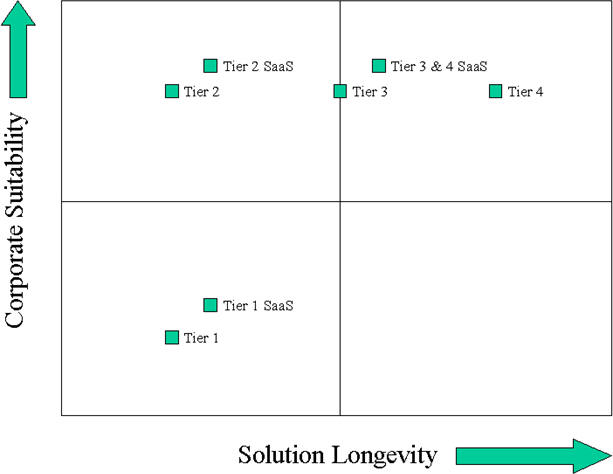
The diagram below (see figure 4) plots this information in quadrants. Tiers 1 to 3 are given a little boost as a SaaS (software as a service, further defined in part one) model. This is because SaaS delivery will take away the overhead of managing a GIS infrastructure locally and could lower total cost of ownership. Also the assumption is that if a company uses SaaS to provide GIS to its integrated spatial analysis, then it is not tied to a particular GIS platform and, therefore, should expect a better solution longevity measure. For this reason, I have put Tier 3 and 4 SaaS at the same point.
Of course SaaS is not the answer for everybody or for all situations. Companies that have lots of custom maps would need to be able upload and use those maps in a secure way. Also data security is a real issue for SaaS deployments. For sensitive data, it must be clear that the data is secure and will not be logged or made available in any way to other parties, including the SaaS host provider. For many agencies this is too high a hurdle. SaaS would not even be considered.
The charted values look a little bit too ordered because at the generic level, all solutions in the same tier are treated as equal. In actual product comparisons, extensibility, ease of configuration, commonality of the solution between supported platforms, and the breadth of spatial analysis capability would cause the products to spread out within the vicinity of their tier rating centroid.
The big organization perspectiveï¿1⁄2
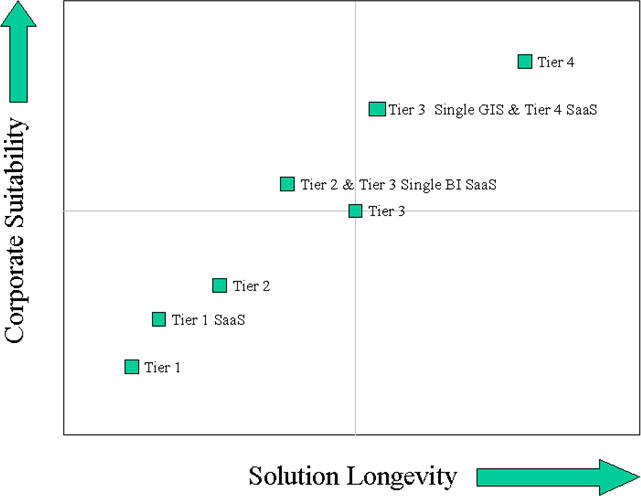
The previous view is adequate for a small organization with a single BI or GIS solution and limited application needs. For larger organizations, however, the view can change dramatically.
We need to take into account that in the absence of a Tier 4 solution, multiple Tier 1, 2 or 3 solutions may be needed to provide an equivalent level of service across the whole organization. This, in turn, increases licensing, training, deployment and other lifecycle costs, as more solutions are required. This situation is exacerbated by the fact that in large organizations there is a higher probability that multiple BI and/or GIS platforms may be in use and it is therefore more than likely to be coupled with a greater desire to rationalize these to a managed service oriented enterprise.
Figure 5 looks at taking a larger organization view of the quadrant diagram. The greater likelihood of having multiple solutions in the absence of a Tier 4 solution drags lower tier solutions further away from the ideal. In this case only Tier 3 solutions with multiple BI tools delivered over SaaS are equivalent to Tier 4 SaaS. Also it is less likely that a single SaaS solution will provide the same overall coverage of user needs in a large organization, so a Tier 4 in-house solution which can be more readily customized rates higher than in Figure 4.
Conclusion
In bygone days, sailors set to sea with their rolls of cartographic charts. All that has changed is the dynamic nature of the data and the way they are displayed. When all is said and done, the most complex spatial representation is really just another chart. A new space is opening based on the convergence of two major technologies. The twin challenges are:
The Players
Within the space that encompasses BI and spatial analysis, there are three types of players. First are the BI vendors, who have been concentrating on moving their offerings to pure Web delivery platforms. While some are better than others in this regard, they all offer the same type of solution. Senior BI executives have indicated that the next wave of differentiation is going to be in the area of mobile devices and spatial analysis.
Second are the GIS vendors, who are in a perilous position because the next great expansion for them is into the BI heartland. Since the main controllers and presentation mechanisms in this domain are the BI tools, the GIS vendors are in danger of being relegated to just another display platform similar to the way databases are used transparently by BI technology today.
In the middle are the integrators, who have perceived the need for these two industries to unite to finally provide a more unified solution.
The Integration Platform
Although still a relatively new domain, a tiered-type classification of solutions is emerging from integrators providing spatial solutions to BI platforms.
These begin with the idea that all that is required is a simple data transfer bridge. As understanding matures, there is the realization that a more complete platform is required, one that manages data flow, controls the application logic and provides the required visualizations back to the BI tool. This platform also allows the user to break the tight coupling between one BI tool and one GIS platform. It allows organizations to select best of breed or even mix and match at the BI and GIS levels. The following table provides a description of the different levels of integration that are possible.
| Tier |
Description
|
| Tier 1 | Custom integrations at the project level where specialist coding is required for each report. Tier 1 solutions also include off-the-shelf integrations that have limited or no application logic associated with the GIS presentation. Limited visualization capability is also a feature of Tier 1 solutions. |
| Tier 2 |
Specific one-to-one
integration. Integrates one GIS to one BI tool. Better integration,
more visualizations, integrated drill/filter, business logic and
behaviors. |
| Tier 3 | Integrates multiple BI tools to one GIS or visa versa. |
| Tier 4 | Integrates multiple BI tools to
multiple GIS platforms. |
To quantify what could be important about these tiers, letï¿1⁄2s look at them from the perspectives of corporate suitability and solution longevity. For corporate suitability, look at cost of ownership, ability to handle differing user needs, extensibility and ease of building and use.
From the solution longevity perspective, look at the longer term resilience to platform change. This is largely based on clean separation between the parts of the solution.
| Tier | Corporate Suitability | Solution
Longevity |
| Tier 1 | A custom built solution could be
exactly what is needed
for a specific solution, but as a corporate solution it lacks the
benefits provided by a generic no-code configuration. The ongoing
maintenance can greatly expand the total cost of ownership. Custom integration requires specialist knowledge and a greater responsibility for system design build and maintenance. Each new application within the company may require a new project. For Tier 1 systems with low visualization capability, the solution will run out of steam as more solutions are required within the organization. This will then lead to lack of suitable solutions, or the addition of a second Tier 1 or above solution (possibly custom) to fill the gaps for the more advanced solution requirements. Therefore Tier 1 would rate low on the corporate suitability scale. |
These systems have a low level of robustness to change and therefore changes in technology; the need for extra solutions or the ongoing cost of maintenance can severely limit the solution longevity. |
| Tier 2 | Tier 2 solutions are better
placed with regard to
corporate suitability. Better visualizations and better configuration
environments allow quicker delivery of systems that meet the needs of
more users. Tier 2 would rate high from a corporate suitability perspective. |
Tier 2 solutions are still
fragile from a solution longevity perspective.
They assume that both the BI and GIS environments will
not change over time. In fact, they can bind a company in such a way
that it can be very expensive to change either platform. |
| Tier 3 | With good visualizations, ease of configuration and support for either multiple GIS or multiple BI platforms, Tier 3 solutions also rate high from the perspective of corporate suitability. | While a Tier 3 solution will
protect the company from
changing one part of the solution, it is still bound to the other part,
as in Tier 2. Also it is essential that the configuration between
different vendors is compatible to allow porting to the new target
easily. |
| Tier 4 | Tier 4 assumes all that is good from 1 to 3 and rates high in this column. | Tier 4 breaks the dependence between BI and GIS and allows either part to be changed to support corporate needs in the respective domain. |
The diagram below (see figure 4) plots this information in quadrants. Tiers 1 to 3 are given a little boost as a SaaS (software as a service, further defined in part one) model. This is because SaaS delivery will take away the overhead of managing a GIS infrastructure locally and could lower total cost of ownership. Also the assumption is that if a company uses SaaS to provide GIS to its integrated spatial analysis, then it is not tied to a particular GIS platform and, therefore, should expect a better solution longevity measure. For this reason, I have put Tier 3 and 4 SaaS at the same point.
Of course SaaS is not the answer for everybody or for all situations. Companies that have lots of custom maps would need to be able upload and use those maps in a secure way. Also data security is a real issue for SaaS deployments. For sensitive data, it must be clear that the data is secure and will not be logged or made available in any way to other parties, including the SaaS host provider. For many agencies this is too high a hurdle. SaaS would not even be considered.
The charted values look a little bit too ordered because at the generic level, all solutions in the same tier are treated as equal. In actual product comparisons, extensibility, ease of configuration, commonality of the solution between supported platforms, and the breadth of spatial analysis capability would cause the products to spread out within the vicinity of their tier rating centroid.
 |
The previous view is adequate for a small organization with a single BI or GIS solution and limited application needs. For larger organizations, however, the view can change dramatically.
We need to take into account that in the absence of a Tier 4 solution, multiple Tier 1, 2 or 3 solutions may be needed to provide an equivalent level of service across the whole organization. This, in turn, increases licensing, training, deployment and other lifecycle costs, as more solutions are required. This situation is exacerbated by the fact that in large organizations there is a higher probability that multiple BI and/or GIS platforms may be in use and it is therefore more than likely to be coupled with a greater desire to rationalize these to a managed service oriented enterprise.
Figure 5 looks at taking a larger organization view of the quadrant diagram. The greater likelihood of having multiple solutions in the absence of a Tier 4 solution drags lower tier solutions further away from the ideal. In this case only Tier 3 solutions with multiple BI tools delivered over SaaS are equivalent to Tier 4 SaaS. Also it is less likely that a single SaaS solution will provide the same overall coverage of user needs in a large organization, so a Tier 4 in-house solution which can be more readily customized rates higher than in Figure 4.
 |
In bygone days, sailors set to sea with their rolls of cartographic charts. All that has changed is the dynamic nature of the data and the way they are displayed. When all is said and done, the most complex spatial representation is really just another chart. A new space is opening based on the convergence of two major technologies. The twin challenges are:
- To harness the power of GIS while convincing the user that this is still just another easily configured chart
- To ensure that the solution has adequate levels of corporate suitability and system longevity.
From Our Homepage
Saying Farewell to an Amazing Journey
Communicating with Maps
Is There a GIS Career Ladder?
What does it mean to be geospatially smart? Series
Ways Real Estate and Property Developers Utilize Melissa GeoData for Data-Driven Decisions
Unlocking Value From Daily Satellite Imagery and Insights
Maximizing the Value of Your Address Data with Geo Addressing
How Indoor Mapping Enhances the Security of Smart Buildings
Look Ahead: AI, Location Intelligence and Efficiency
Collaboration Takes on Sea Level Rise & Dynamic Technology Environments
Brownies for Brownfields
Has Everything Been Mapped Already?
How Is Data Literacy Changing in an Artificial Intelligence Landscape
Portfolios for GIS Professionals: More Than Just Maps
How to Create a Distance Matrix in QGIS - A Step-by-Step Guide
7 Ideas for Bringing GIS into the K-12 Classroom
The Geography of Movement