MapInfo
Professional version 10.0 was launched in June, 2009 and is the latest
release of the desktop location intelligence software from Pitney Bowes
Business Insight. The latest software release provides a new look and
feel to the user interface with new icons on the toolbars and menus, a
redesigned Layer Control window, updated database access support,
enhanced output options and new tools such as a Proportional Overlap
tool. This review will focus on the new enhancements to the software
from the previous version.
New User Interface Design
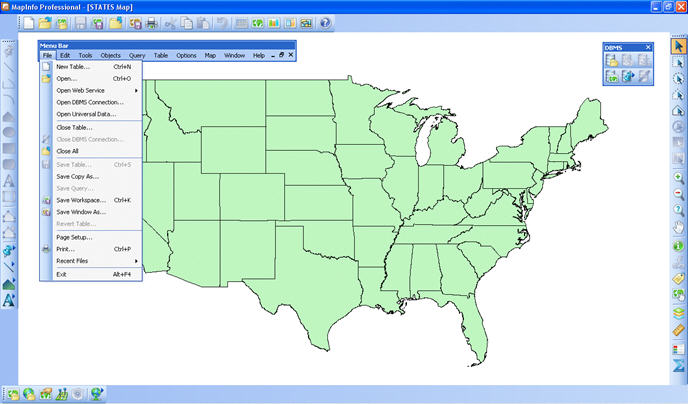
The first thing that users of previous versions of MapInfo Professional will notice is a redesigned user interface. The icons on the toolbars have a cleaner and crisper look as they have been re-designed to look better. The menus have also been updated to show the new icons alongside the corresponding commands in the menus. The menus and toolbars can be docked or floated as before; however, they can now be docked to all four sides of the user interface, top, bottom, left and right which provide additional real estate for the windows in the application. The toolbars are resizable, similar to previous versions of the product, by clicking and dragging the corner of the toolbar. Figure 1 shows the redesigned user interface with the new icons, the toolbars are docked to all four sides of the application and the File menu shows the new icons next to the corresponding menu items. The DBMS toolbar in Figure 1 has been resized to show two rows of buttons.
Redesigned Layer Control Box
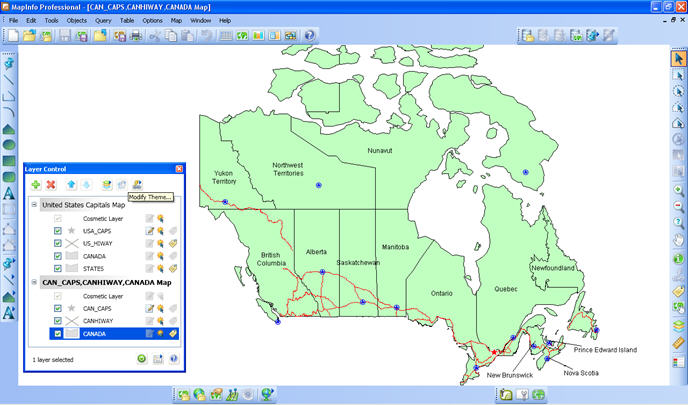
The Layer Control has also been redesigned from a dialog box to an interactive window, which enables the Layer Control to act independently of the map window. Previous versions of MapInfo Professional had the Layer Control dialog box that locked the focus of the software to the dialog box when it was open. The enhancement in the current version allows the Layer Control window to be open for the user to interact with the map window and Layer Control simultaneously. The redesigned Layer Control window is completely resizable, can be docked to the application window, can be a floating window, and is not stuck in the application, so that it can be displayed outside of the application or in a dual screen mode. The new Layer Control window no longer has an OK and Cancel buttons and changes to the layers take place immediately. Figure 2 displays a floating Layer Control window on a map window.
The new Layer Control window provides buttons to Add/Remove Layers, reorder layers, access a Layer's properties, Modify Theme, Hotlink Options, Automatic Map Drawing, Layer Control Options and Help. The icons to the right of a layer's name can be clicked to make a layer editable, turn layers on and off, and to display the layer's labels. The icons will be gray if the option is not selected and will be shown with color if the layer option is selected. The Automatic Map Drawing option allows users to pause the map drawing if they are making many changes to the layers in the Layer Control. The map window will redraw immediately after a change is made in the Layer Control, prompting the need to allow the user to suspend the map redraw when multiple changes are needed in the Layer Control.
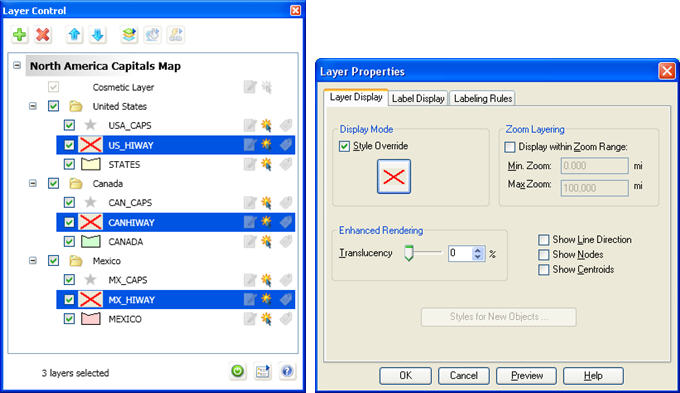
Users can modify the properties and labels of multiple layers at once by using the Shift and Ctrl keys to select layers and then right click to display a menu to edit the layer properties or labels. The Style Override options can be applied to change the color and style for all the selected layers. The layers do not have to be of the same type to change the style. In addition, the user can change multiple layer settings in multiple map windows at the same time. Figure 3 displays the Layer Control window with three layers selected, and the Layer Properties Style Override changes the style for the three selected layers. The Layer Properties dialog box contains a Preview button that allows the user to view how the layer property changes will look on the map and can then decide whether to accept or cancel the changes. Layers that have Style Overrides will display an icon with the Style Override symbol in the Layer Control window or a default gray icon will display for a layer with no style changes. Figure 3 shows three layers with Style Overrides: United States, Canada and Mexico, which have icons showing the Style override for these layers in the Layer Control dialog box.
The Layer Control window allows the user to change the map window name by right-clicking on the map window name in the Layer Control window and selecting the Rename option from the menu. MapInfo Professional, by default, names map windows with the layers in the map window. For example, in Figure 2, the title of the top map window was renamed to "United States Capitals Map" while the second map window is named after the layers in the map window, "CAN_CAPS, CANHIWAY, CANADA Map".
MapInfo Professional provides the ability to create Group layers in the Layer Control window. Grouping layers allows a user to organize layers and enables the user to turn all the layers in the group on and off with a single click. Figure 3 displays the Layer Control window that contains three group layers, United States, Canada and Mexico that organizes the layers on the map by country.
Updated Database Access Support
MapInfo Professional now provides full support for Microsoft SQL Server 2008. The previous version of MapInfo Professional provided Read/Write access to the attribute data, but only supported Read-Only access to the spatial data. The latest release supports Read/Write access to the spatial and attribute data stored in Microsoft SQL Server 2008 databases.
MapInfo Professional provides direct access to the Microsoft Office 2007 versions of Excel and Access. The new version of Microsoft Office 2007 has longer file extensions for the files than previous versions of Microsoft Office, such as .ACCDB for Access 2007 databases and .XLSX for Excel 2007 files. The sample data installed with the product includes database files in the new Microsoft Office 2007 Access and Excel file formats.
MapInfo Professional provides access to spatial data stored in PostGIS databases. PostGIS is a freely available and Open Geographic Consortium (OGC) compliant backend spatial database for geographic information systems. PostGIS spatially enables the open source PostgreSQL server by supporting geographic objects in the database management system. Pitney Bowes Business Insight recommends connecting to a PostGIS databases with the PostgreSQL ANSI driver that is supplied with PostgreSQL.
Enhanced Map Output Options
The output options have been enhanced in MapInfo Professional to include the ability to export Layered PDF files of maps created with MapInfo Professional. Layered PDFs allow the user to export all the layers in a map to an Adobe PDF file. Once a layered PDF file is open in Adobe Acrobat, the user can turn the layers on and off as if they were using MapInfo Professional. (The file can also be opened in Adobe Reader, but the layers cannot be turned on and off). This could be very useful for users who have to output a map that allows the person viewing the information to have the ability to change the map appearance in the PDF file. The File > Print menu provides an option to select the MapInfo PDF Printer Version 10.0 in the Printer listbox that will export the map or layout to a layered PDF file. The MapInfo PDF printer driver included with the software provides the ability to create layered PDF files. Other PDF printer drivers will create a static PDF map without the layer information. This link shows a PDF file that I created to provide an example of a layered PDF file.
MapInfo Professional includes a new function to add a dynamic scale bar to the Map window that updates automatically when a user changes the scale on the map by zooming in and out. The scale bar can be added to the Map window by selecting Map > Create Scale Bar menu option. The scale bar options can be set with a dialog box that allows the user to change the style, font, colors and the bar length. The user can access the scale bar options dialog box by double-clicking on the scale bar on the map window. The user can also move the scale bar by clicking on the scale bar and dragging it to a new location on the map window.
New Tools
MapInfo Professional includes a new tool, called the Proportional Overlay Tool, which allows a user to intersect two map layers where data from a base layer is aggregated by the proportion of the area that intersects the target layer and the data is then appended to the target layer. For example, a user may have a polygon in a target layer that intersects several US Census tracts that contains population data. The Proportional Overlay tool will aggregate the population based on the area from each census tract that intersects the polygon to arrive at a population count for the intersecting polygon. A tract where 50% of the area that intersects the polygon will contribute 50% of that tract's population to the total population count for the polygon. The Proportional Overlay tool assumes an evenly distributed population from the base layer that is providing the data.
The Proportional Overlay tool contains three options to aggregate data: Proportional Sum, Proportional Average and Proportional Weighted Average. The Proportional Sum calculation is a sum calculation based on how much area that one object intersects another object. The Proportional Average calculation is an average calculation based on how much area that one object intersects another object. The Proportional Weighted Average calculation is a weighted average calculation based on how much area that one object intersects another object. The weighted average is used to give more weight to one value when averaging by selecting a numeric field in a table. Figure 4 displays a map with three polygons and a Zip Code layer that contains population data. The Proportional Overlay tool was used to compute the Population column in the DC_Regions browser using the proportional sum of the Zip Code population data that intersects the polygons in the DC_Regions layer.
MapInfo Professional 9.5 was the first version to include the MapCAD
tools with MapInfo Professional. However, the MapCAD tools had to be
installed as a separate option with the standard MapInfo Professional
installation. MapInfo Professional 10.0 integrates the MapCAD
installation.
Conclusion
The new interface in MapInfo Professional 10.0 is certainly more visually appealing than previous versions. The latest release has greatly improved the ease of use of the Layer Control. In previous versions, users had to click OK buttons several times before a change such as a Style Override would occur in the map window. The Layer Control is much easier to work with now and changes occur instantly as long as the Automatic Map Drawing button is not selected. Users have more choices to store their MapInfo Professional data using proprietary databases such as Microsoft SQL Server 2008 and Microsoft Office 2007 products as well as an open source products PostgreSQL and PostGIS. The ability to create layered PDF files is a time-saving enhancement that allows the end users of the maps to be able to control the display of the map output in Adobe Acrobat software instead of having to keep recreating the maps one at a time. Lastly, the Proportional Overlay tool is a new tool that allows users to quickly calculate summations and averages of data when the polygons of two layers do not line up exactly.
New User Interface Design
The first thing that users of previous versions of MapInfo Professional will notice is a redesigned user interface. The icons on the toolbars have a cleaner and crisper look as they have been re-designed to look better. The menus have also been updated to show the new icons alongside the corresponding commands in the menus. The menus and toolbars can be docked or floated as before; however, they can now be docked to all four sides of the user interface, top, bottom, left and right which provide additional real estate for the windows in the application. The toolbars are resizable, similar to previous versions of the product, by clicking and dragging the corner of the toolbar. Figure 1 shows the redesigned user interface with the new icons, the toolbars are docked to all four sides of the application and the File menu shows the new icons next to the corresponding menu items. The DBMS toolbar in Figure 1 has been resized to show two rows of buttons.
 |
Redesigned Layer Control Box
The Layer Control has also been redesigned from a dialog box to an interactive window, which enables the Layer Control to act independently of the map window. Previous versions of MapInfo Professional had the Layer Control dialog box that locked the focus of the software to the dialog box when it was open. The enhancement in the current version allows the Layer Control window to be open for the user to interact with the map window and Layer Control simultaneously. The redesigned Layer Control window is completely resizable, can be docked to the application window, can be a floating window, and is not stuck in the application, so that it can be displayed outside of the application or in a dual screen mode. The new Layer Control window no longer has an OK and Cancel buttons and changes to the layers take place immediately. Figure 2 displays a floating Layer Control window on a map window.
 |
The new Layer Control window provides buttons to Add/Remove Layers, reorder layers, access a Layer's properties, Modify Theme, Hotlink Options, Automatic Map Drawing, Layer Control Options and Help. The icons to the right of a layer's name can be clicked to make a layer editable, turn layers on and off, and to display the layer's labels. The icons will be gray if the option is not selected and will be shown with color if the layer option is selected. The Automatic Map Drawing option allows users to pause the map drawing if they are making many changes to the layers in the Layer Control. The map window will redraw immediately after a change is made in the Layer Control, prompting the need to allow the user to suspend the map redraw when multiple changes are needed in the Layer Control.
Users can modify the properties and labels of multiple layers at once by using the Shift and Ctrl keys to select layers and then right click to display a menu to edit the layer properties or labels. The Style Override options can be applied to change the color and style for all the selected layers. The layers do not have to be of the same type to change the style. In addition, the user can change multiple layer settings in multiple map windows at the same time. Figure 3 displays the Layer Control window with three layers selected, and the Layer Properties Style Override changes the style for the three selected layers. The Layer Properties dialog box contains a Preview button that allows the user to view how the layer property changes will look on the map and can then decide whether to accept or cancel the changes. Layers that have Style Overrides will display an icon with the Style Override symbol in the Layer Control window or a default gray icon will display for a layer with no style changes. Figure 3 shows three layers with Style Overrides: United States, Canada and Mexico, which have icons showing the Style override for these layers in the Layer Control dialog box.
The Layer Control window allows the user to change the map window name by right-clicking on the map window name in the Layer Control window and selecting the Rename option from the menu. MapInfo Professional, by default, names map windows with the layers in the map window. For example, in Figure 2, the title of the top map window was renamed to "United States Capitals Map" while the second map window is named after the layers in the map window, "CAN_CAPS, CANHIWAY, CANADA Map".
MapInfo Professional provides the ability to create Group layers in the Layer Control window. Grouping layers allows a user to organize layers and enables the user to turn all the layers in the group on and off with a single click. Figure 3 displays the Layer Control window that contains three group layers, United States, Canada and Mexico that organizes the layers on the map by country.
 |
MapInfo Professional now provides full support for Microsoft SQL Server 2008. The previous version of MapInfo Professional provided Read/Write access to the attribute data, but only supported Read-Only access to the spatial data. The latest release supports Read/Write access to the spatial and attribute data stored in Microsoft SQL Server 2008 databases.
MapInfo Professional provides direct access to the Microsoft Office 2007 versions of Excel and Access. The new version of Microsoft Office 2007 has longer file extensions for the files than previous versions of Microsoft Office, such as .ACCDB for Access 2007 databases and .XLSX for Excel 2007 files. The sample data installed with the product includes database files in the new Microsoft Office 2007 Access and Excel file formats.
MapInfo Professional provides access to spatial data stored in PostGIS databases. PostGIS is a freely available and Open Geographic Consortium (OGC) compliant backend spatial database for geographic information systems. PostGIS spatially enables the open source PostgreSQL server by supporting geographic objects in the database management system. Pitney Bowes Business Insight recommends connecting to a PostGIS databases with the PostgreSQL ANSI driver that is supplied with PostgreSQL.
Enhanced Map Output Options
The output options have been enhanced in MapInfo Professional to include the ability to export Layered PDF files of maps created with MapInfo Professional. Layered PDFs allow the user to export all the layers in a map to an Adobe PDF file. Once a layered PDF file is open in Adobe Acrobat, the user can turn the layers on and off as if they were using MapInfo Professional. (The file can also be opened in Adobe Reader, but the layers cannot be turned on and off). This could be very useful for users who have to output a map that allows the person viewing the information to have the ability to change the map appearance in the PDF file. The File > Print menu provides an option to select the MapInfo PDF Printer Version 10.0 in the Printer listbox that will export the map or layout to a layered PDF file. The MapInfo PDF printer driver included with the software provides the ability to create layered PDF files. Other PDF printer drivers will create a static PDF map without the layer information. This link shows a PDF file that I created to provide an example of a layered PDF file.
MapInfo Professional includes a new function to add a dynamic scale bar to the Map window that updates automatically when a user changes the scale on the map by zooming in and out. The scale bar can be added to the Map window by selecting Map > Create Scale Bar menu option. The scale bar options can be set with a dialog box that allows the user to change the style, font, colors and the bar length. The user can access the scale bar options dialog box by double-clicking on the scale bar on the map window. The user can also move the scale bar by clicking on the scale bar and dragging it to a new location on the map window.
New Tools
MapInfo Professional includes a new tool, called the Proportional Overlay Tool, which allows a user to intersect two map layers where data from a base layer is aggregated by the proportion of the area that intersects the target layer and the data is then appended to the target layer. For example, a user may have a polygon in a target layer that intersects several US Census tracts that contains population data. The Proportional Overlay tool will aggregate the population based on the area from each census tract that intersects the polygon to arrive at a population count for the intersecting polygon. A tract where 50% of the area that intersects the polygon will contribute 50% of that tract's population to the total population count for the polygon. The Proportional Overlay tool assumes an evenly distributed population from the base layer that is providing the data.
The Proportional Overlay tool contains three options to aggregate data: Proportional Sum, Proportional Average and Proportional Weighted Average. The Proportional Sum calculation is a sum calculation based on how much area that one object intersects another object. The Proportional Average calculation is an average calculation based on how much area that one object intersects another object. The Proportional Weighted Average calculation is a weighted average calculation based on how much area that one object intersects another object. The weighted average is used to give more weight to one value when averaging by selecting a numeric field in a table. Figure 4 displays a map with three polygons and a Zip Code layer that contains population data. The Proportional Overlay tool was used to compute the Population column in the DC_Regions browser using the proportional sum of the Zip Code population data that intersects the polygons in the DC_Regions layer.
 |
Conclusion
The new interface in MapInfo Professional 10.0 is certainly more visually appealing than previous versions. The latest release has greatly improved the ease of use of the Layer Control. In previous versions, users had to click OK buttons several times before a change such as a Style Override would occur in the map window. The Layer Control is much easier to work with now and changes occur instantly as long as the Automatic Map Drawing button is not selected. Users have more choices to store their MapInfo Professional data using proprietary databases such as Microsoft SQL Server 2008 and Microsoft Office 2007 products as well as an open source products PostgreSQL and PostGIS. The ability to create layered PDF files is a time-saving enhancement that allows the end users of the maps to be able to control the display of the map output in Adobe Acrobat software instead of having to keep recreating the maps one at a time. Lastly, the Proportional Overlay tool is a new tool that allows users to quickly calculate summations and averages of data when the polygons of two layers do not line up exactly.
From Our Homepage
Saying Farewell to an Amazing Journey
Communicating with Maps
Is There a GIS Career Ladder?
What does it mean to be geospatially smart? Series
Ways Real Estate and Property Developers Utilize Melissa GeoData for Data-Driven Decisions
Unlocking Value From Daily Satellite Imagery and Insights
Maximizing the Value of Your Address Data with Geo Addressing
How Indoor Mapping Enhances the Security of Smart Buildings
Look Ahead: AI, Location Intelligence and Efficiency
Collaboration Takes on Sea Level Rise & Dynamic Technology Environments
Brownies for Brownfields
Has Everything Been Mapped Already?
How Is Data Literacy Changing in an Artificial Intelligence Landscape
Portfolios for GIS Professionals: More Than Just Maps
How to Create a Distance Matrix in QGIS - A Step-by-Step Guide
7 Ideas for Bringing GIS into the K-12 Classroom
The Geography of Movement