Distributor
MapInfo Corporation
One Global View
Troy, New York 12180
Tel: 518-285-6000 or 800-FASTMAP
Fax: 518-285-6070
MapInfo Professional version 8.5 is the latest version of MapInfo’s desktop GIS software. The goals of the latest release of MapInfo Professional are to:
Web Services Enhancements
The latest version of MapInfo Professional provides the ability to connect to servers running MapInfo’s MapMarker and Envinsa software products as well as MapInfo’s Envinsa On-Line Services (EOLS). EOLS provide users with access to functionality without the need for additional software and/or data in-house. The Web services can be accessed via the Internet on a subscription basis, which expands the value of MapInfo Professional with minimal internal resources and without the need for additional capital investment.
MapMarker is a geocoding product that assigns coordinates to an address based on how well that address matches entries in MapMarker’s internal address dictionary. MapMarker v11 or higher is required to use the MapMarker connectivity option. Geocoding functionality can be accessed through the Table menu by choosing the Geocode Using Server option. First, the user will be asked to specify the geocoding server and the geocoding server preferences – Input, Output, Table Options, Common Options and Advanced Output. Users can then geocode a table of addresses interactively or automatically, as if the geocoding engine was installed on their local computer.
The Envinsa server product provides a wider range of Web services than MapMarker server. Envinsa can be purchased as a product or can be accessed as an online subscription service. Table 1 shows the Web services that MapInfo Professional v8.5 can access through MapMarker and Envinsa. Additional Web services will be provided in future releases of MapInfo.
Envinsa servers and EOLS require more security than MapMarker servers so users will need a username and password to access Envinsa services. Users can connect to EOLS through an option in the MapInfo Help menu. Users can register for a free 90-day EOLS trial account that is good for 1,000 free credits to test out the Web services. To create geographic data in the US or Canada, one credit can be used to geocode one address and one drivetime polygon can be created for one hundred credits.
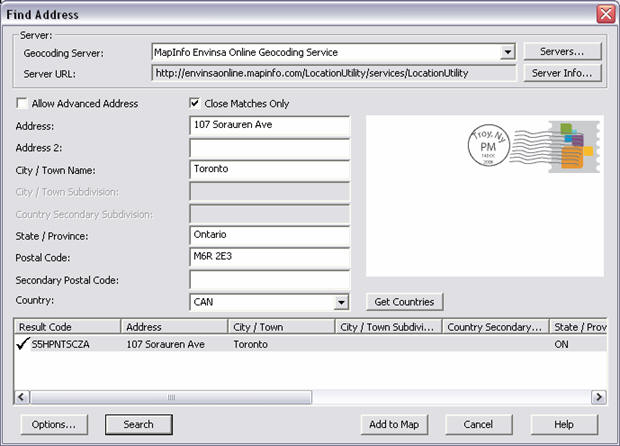
Figure 1 shows the Find Address dialog box for the MapInfo Envinsa or MapMarker Geocoding Web Service. Users can enter the address information to locate an address. The Web service can also switch between addresses in multiple countries. The user types the address into the fields and the results will be shown in the list-box. The user can then select the correct address in the results list box and press the Add to Map button to add a point symbol to the map.
The Envinsa or EOLS Drivetime Web Service uses the latest road networks and search algorithms to create polygons based on driving distance or time from a specified location. The routing server for the Drivetime Web Service will need to be configured in the Web Services category of the Options > Preferences menu. To create drivetime polygons, select Driving Regions from the Objects menu. Figure 2 shows the options within the Create Driving Regions dialog box. Drivetime polygons will be created on the Envinsa server based on the options selected, and a TAB file of the drivetime polygon will be added to the MapInfo workspace and can be saved permanently to the local computer.
Map Functionality Enhancements
MapInfo Professional provides two new ways to merge map layers from one map window into another map window. The first method is to use the Drag Map Window tool, which is a new tool on the Main Toolbar. Users should have the two map windows open, select the Drag Map Window tool, and drag the source map window onto the destination map window to copy all the layers from the source window to the destination window.
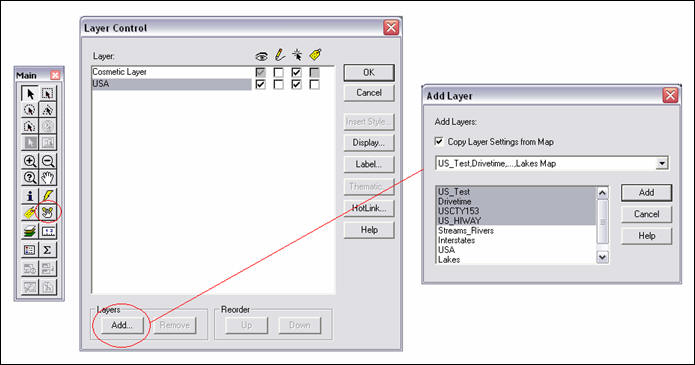
The second method to merge maps is to copy layers from the Layer Control dialog box. Users can press the Add Data button on the Layer Control dialog box and check the Copy Layer Settings from Map checkbox. The combo box provides a list of all open map windows and their layers so users can select a layer and press the Add button to add the layer into the current map window. The destination map setting takes precedence when layers are merged from a source map on top of a destination map. Figure 3 shows both methods for merging maps with the Drag Map Window tool circled on the Main toolbar on the left and using the Layer Control dialog to copy individual layers from one map to the next.
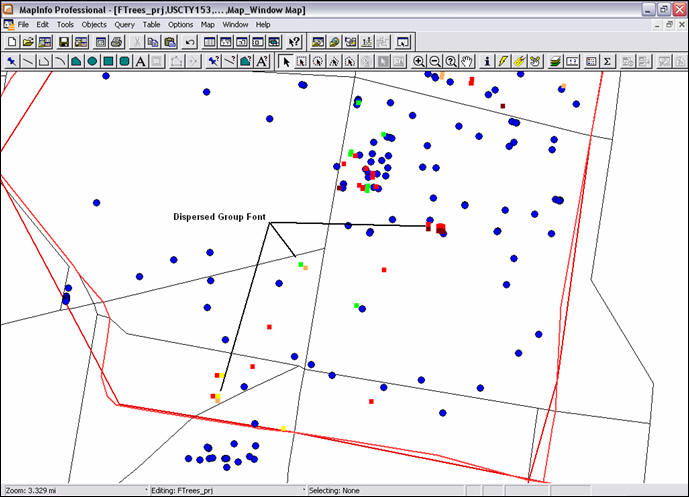
MapInfo Professional includes a new font called the Dispersed Group that enables users to construct point groups for stacked points. The Dispersed Group font contains point symbols that are slightly offset in different directions from the x, y coordinate of the symbol. This can be very useful if your data has many points at the same exact location, but the points have different attributes. The Dispersed Group will separate the stacked points into groups with different symbols at the same location. A typical example would be in law enforcement where multiple incidents may occur at the same place, but each event is different in nature (ex. robbery, murder, aggravated assault).
To create a point group with the Dispersed Group the user will have to set the point layer as editable and create a query to select individual groups of points. The user can change the symbol style by choosing Options>Symbol Style. The user will change the Font to the MapInfo Dispersed Group which will allow the users to select the style and color for the selected points. Users should repeat this process to assign different symbol styles to groups of stacked points. Figure 4 shows an example of a point layer with blue circles and some of the points classified using the Dispersed Group in areas where points are stacked upon each other.
Additional functionality enhancements for mapping include the following.
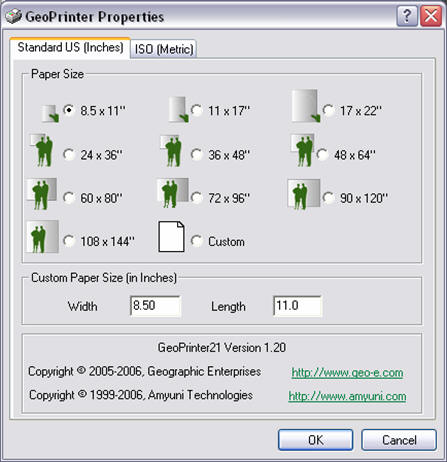
MapInfo Professional 8.5 includes a third party tool called GeoPrinter that allows users to print maps directly to Adobe Acrobat PDF files. The GeoPrinter utility can be accessed through the Windows>Print menu by selecting GeoPrinter in the list of printers. The GeoPrinter properties allow the user to select the page size in inches or metric units for the PDF file. The GeoPrinter properties dialog is shown in Figure 5. After the PDF file is created, users can print or share the file with others. The GeoPrinter comes with a GeoPrint Viewer to show the PDF file after it is created. The GeoPrinter utility is useful for users who do not have Adobe Distiller installed on their computers to generate PDF files of their maps.
Tool Manager Enhancements
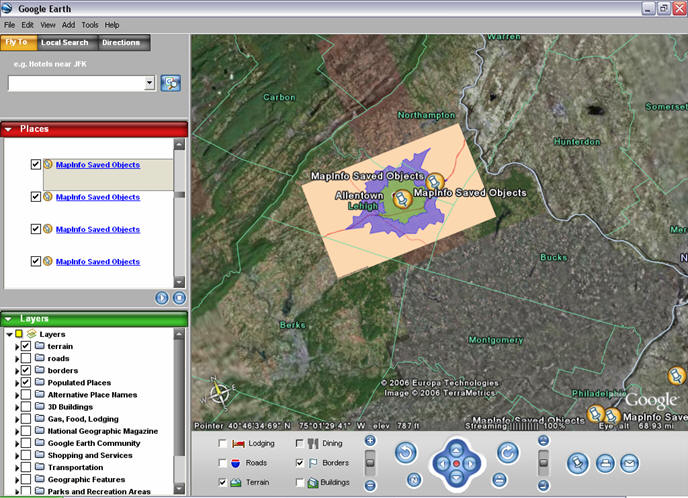
MapInfo Professional includes a new Link Utility for Google Earth in the Tool Manager that allows users to export MapInfo data and display it within Google Earth. Users can export a MapInfo window as a raster image into Google Earth. The raster image is automatically projected into the Google Earth projection. Users can also select objects from layers and export them into Google’s Keyhole Markup Language (KML). Once the objects are selected, the user can specify the fields from the MapInfo table to export with the objects. Figure 6 shows the Google Earth interface with a raster image of a MapInfo window and a point layer that was exported from MapInfo Professional into KML. Once the data is displayed in Google Earth, the transparency setting can be changed for the raster image and the user can zoom and get information about the exported objects.
MapInfo provides sample tools on the website that users can download to access live Yahoo Traffic Feeds and a GeoRSS Feed reader. Both tools can be downloaded.
After the user downloads the tools and unzips the files, the user will have to add the tools to MapInfo Professional through the Tool Manager. The Yahoo Traffic Feed tool places a new menu on the title bar titled Sample. To access the traffic feeds, the user selects Sample>Get Yahoo Traffic which displays a dialog box. The user will enter the ZIP Code, magnification (4, 10 or 40 miles) and severity (minor, moderate, major or critical). The traffic RSS feeder will provide a dynamically generated feed with the latest traffic information for a defined area. The traffic feed layer will be added to the map and placed in the Layer Control and users can open up a browser window of the traffic information.
The GeoRSS Feed reader tool adds two buttons to the MapInfo Professional interface to open the GeoRSS Manager dialog and to refresh all active GeoRSS feeds. The GeoRSS Manager allows users to enter sites that serve GeoRSS feeds to add these feeds to their maps. Examples of websites that serve GeoRSS feeds include platial.com and mapufacture.com. The dialog box for the GeoRSS Manager needs to be expanded as it is sometimes hard to see the full website link to a GeoRSS feed in the dialog box.
Raster Image Enhancements
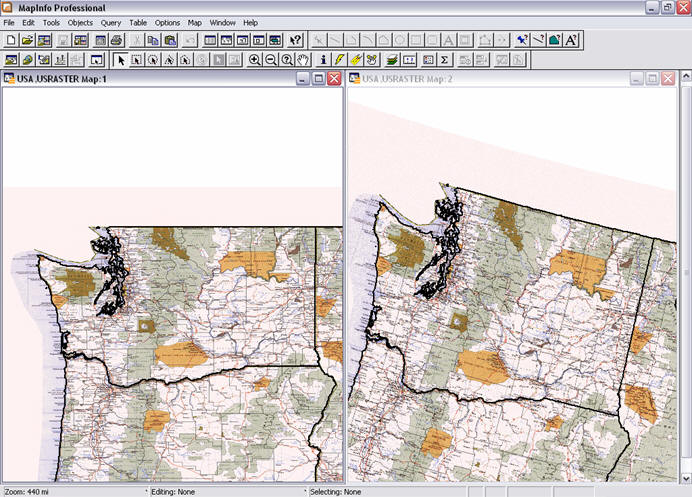
MapInfo Professional 8.5 provides new functionality to rotate and reproject registered raster images on the fly to a different coordinate system than the source image. This new function recalculates the pixel values of the source image so that it can be displayed correctly in the destination image. MapInfo provides two methods for recalculating the pixel values: Cubic Convolution and Nearest Neighbor. Figure 7 shows two map windows; the map window on the left contains a raster image in a Latitude/Longitude projection, while the map window on the right shows the same raster image reprojected into an Albers Equal Area projection using the Cubic Convolution method.
Users can access the Image Processing Preferences through the Map>Options menu or the Options>Preferences menu for more permanent settings. The Image Processing dialog allows the user to control when MapInfo will reproject images and the Resampling Method. Images can be automatically reprojected by selecting the Always or Optimized options or raster reprojection can be prevented by selecting the Never option. Once the Always or Optimized option is selected, the user can select either the Cubic Convolution or Nearest Neighbor Resampling Method. One thing to note is that MapInfo will reproject the raster image each time the map is redrawn, which can take a long time for large raster maps. Users can minimize the redraw time by setting the zoom layering option on the raster layer such that the image will be visible and reprojected only when zoomed in close.
Other raster image enhancements include an optional large crosshair in the Raster Image Registration window that enables users to select points to register raster images more accurately. MapInfo Professional 8.5 also provides a new System Setting preference that allows users to display Vertical Mapper GRD files as grid files instead of raster files. The Vertical Mapper grids can be displayed in the 3D window and their colors and legends can be changed. Users can get information about the Vertical Mapper grid cells by selecting a cell with the Info tool.
Conclusion
As I stated in my previous reviews of MapInfo Professional (8.0, 7.0), the look and feel of MapInfo Professional has been the same throughout the succession of released versions. The product innovation of MapInfo Professional continues to be driven by customer demand. The architecture of the software allows MapInfo to insert new functionality that is easy for users to find. For example, when a new tool is added, such as the Link Utility for Google Earth, it is placed in the Tool Manager so users can find the new tool easily. Experienced MapInfo Professional users should have no problem learning about the latest enhancements to the newest version of the product and should be able to apply these enhancements to their workspaces.
MapInfo Corporation
One Global View
Troy, New York 12180
Tel: 518-285-6000 or 800-FASTMAP
Fax: 518-285-6070
MapInfo Professional version 8.5 is the latest version of MapInfo’s desktop GIS software. The goals of the latest release of MapInfo Professional are to:
- Simplify high quality location enablement
- Provide greater analytical capability
- Simplify and speed up analysis
Web Services Enhancements
The latest version of MapInfo Professional provides the ability to connect to servers running MapInfo’s MapMarker and Envinsa software products as well as MapInfo’s Envinsa On-Line Services (EOLS). EOLS provide users with access to functionality without the need for additional software and/or data in-house. The Web services can be accessed via the Internet on a subscription basis, which expands the value of MapInfo Professional with minimal internal resources and without the need for additional capital investment.
MapMarker is a geocoding product that assigns coordinates to an address based on how well that address matches entries in MapMarker’s internal address dictionary. MapMarker v11 or higher is required to use the MapMarker connectivity option. Geocoding functionality can be accessed through the Table menu by choosing the Geocode Using Server option. First, the user will be asked to specify the geocoding server and the geocoding server preferences – Input, Output, Table Options, Common Options and Advanced Output. Users can then geocode a table of addresses interactively or automatically, as if the geocoding engine was installed on their local computer.
The Envinsa server product provides a wider range of Web services than MapMarker server. Envinsa can be purchased as a product or can be accessed as an online subscription service. Table 1 shows the Web services that MapInfo Professional v8.5 can access through MapMarker and Envinsa. Additional Web services will be provided in future releases of MapInfo.
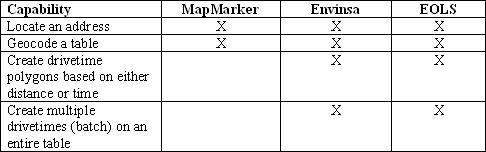 |
Envinsa servers and EOLS require more security than MapMarker servers so users will need a username and password to access Envinsa services. Users can connect to EOLS through an option in the MapInfo Help menu. Users can register for a free 90-day EOLS trial account that is good for 1,000 free credits to test out the Web services. To create geographic data in the US or Canada, one credit can be used to geocode one address and one drivetime polygon can be created for one hundred credits.
Figure 1 shows the Find Address dialog box for the MapInfo Envinsa or MapMarker Geocoding Web Service. Users can enter the address information to locate an address. The Web service can also switch between addresses in multiple countries. The user types the address into the fields and the results will be shown in the list-box. The user can then select the correct address in the results list box and press the Add to Map button to add a point symbol to the map.
 |
The Envinsa or EOLS Drivetime Web Service uses the latest road networks and search algorithms to create polygons based on driving distance or time from a specified location. The routing server for the Drivetime Web Service will need to be configured in the Web Services category of the Options > Preferences menu. To create drivetime polygons, select Driving Regions from the Objects menu. Figure 2 shows the options within the Create Driving Regions dialog box. Drivetime polygons will be created on the Envinsa server based on the options selected, and a TAB file of the drivetime polygon will be added to the MapInfo workspace and can be saved permanently to the local computer.
 |
Map Functionality Enhancements
MapInfo Professional provides two new ways to merge map layers from one map window into another map window. The first method is to use the Drag Map Window tool, which is a new tool on the Main Toolbar. Users should have the two map windows open, select the Drag Map Window tool, and drag the source map window onto the destination map window to copy all the layers from the source window to the destination window.
The second method to merge maps is to copy layers from the Layer Control dialog box. Users can press the Add Data button on the Layer Control dialog box and check the Copy Layer Settings from Map checkbox. The combo box provides a list of all open map windows and their layers so users can select a layer and press the Add button to add the layer into the current map window. The destination map setting takes precedence when layers are merged from a source map on top of a destination map. Figure 3 shows both methods for merging maps with the Drag Map Window tool circled on the Main toolbar on the left and using the Layer Control dialog to copy individual layers from one map to the next.
 |
MapInfo Professional includes a new font called the Dispersed Group that enables users to construct point groups for stacked points. The Dispersed Group font contains point symbols that are slightly offset in different directions from the x, y coordinate of the symbol. This can be very useful if your data has many points at the same exact location, but the points have different attributes. The Dispersed Group will separate the stacked points into groups with different symbols at the same location. A typical example would be in law enforcement where multiple incidents may occur at the same place, but each event is different in nature (ex. robbery, murder, aggravated assault).
To create a point group with the Dispersed Group the user will have to set the point layer as editable and create a query to select individual groups of points. The user can change the symbol style by choosing Options>Symbol Style. The user will change the Font to the MapInfo Dispersed Group which will allow the users to select the style and color for the selected points. Users should repeat this process to assign different symbol styles to groups of stacked points. Figure 4 shows an example of a point layer with blue circles and some of the points classified using the Dispersed Group in areas where points are stacked upon each other.
 |
Additional functionality enhancements for mapping include the following.
- Three new buttons were added to the Standard toolbar that Open Workspaces, Save Workspaces and Save Window.
- Users can view a list of tables in the map without opening the Layer Control dialog box. To see a list of tables select the Tables menu and choose List Open Tables to see a dialog box with the table list. There is a checkbox in the Table List dialog box to Group by Type that groups the tables by format type such as raster, native MapInfo tables, Web Mapping Service (WMS), Web Feature Service (WFS) and linked tables.
- There are new System Settings Preferences that set the default distance and area units for the application.
- Users can save a Map Window as a geographically referenced Tab file using the Save Window As option. The Save Window As dialog box includes a checkbox to create a Geographically Referenced Tab file which will create an image file with registration points based on the current map view.
- MapInfo provides a new checkbox in the Query and SQL Query dialog boxes that allows users to see query results visually on a map by checking the Find Results in Current Map Window checkbox. The results of the query will display on the map when the checkbox is checked.
- The current version of MapInfo Professional enables users to copy the contents of the Statistics and Message windows to the clipboard. This enhancement allows the user to capture statistical information and messages from MapBasic programs and copy that information into other software applications.
- The Modify Table Structure, New Table Structure, and Layer Control dialog boxes are now bigger than they were in the previous version of MapInfo Professional. Users can see more rows of information displayed in the dialog boxes. The Status Bar has also been enlarged to ensure that information is more readable.
MapInfo Professional 8.5 includes a third party tool called GeoPrinter that allows users to print maps directly to Adobe Acrobat PDF files. The GeoPrinter utility can be accessed through the Windows>Print menu by selecting GeoPrinter in the list of printers. The GeoPrinter properties allow the user to select the page size in inches or metric units for the PDF file. The GeoPrinter properties dialog is shown in Figure 5. After the PDF file is created, users can print or share the file with others. The GeoPrinter comes with a GeoPrint Viewer to show the PDF file after it is created. The GeoPrinter utility is useful for users who do not have Adobe Distiller installed on their computers to generate PDF files of their maps.
 |
Tool Manager Enhancements
MapInfo Professional includes a new Link Utility for Google Earth in the Tool Manager that allows users to export MapInfo data and display it within Google Earth. Users can export a MapInfo window as a raster image into Google Earth. The raster image is automatically projected into the Google Earth projection. Users can also select objects from layers and export them into Google’s Keyhole Markup Language (KML). Once the objects are selected, the user can specify the fields from the MapInfo table to export with the objects. Figure 6 shows the Google Earth interface with a raster image of a MapInfo window and a point layer that was exported from MapInfo Professional into KML. Once the data is displayed in Google Earth, the transparency setting can be changed for the raster image and the user can zoom and get information about the exported objects.
 |
MapInfo provides sample tools on the website that users can download to access live Yahoo Traffic Feeds and a GeoRSS Feed reader. Both tools can be downloaded.
After the user downloads the tools and unzips the files, the user will have to add the tools to MapInfo Professional through the Tool Manager. The Yahoo Traffic Feed tool places a new menu on the title bar titled Sample. To access the traffic feeds, the user selects Sample>Get Yahoo Traffic which displays a dialog box. The user will enter the ZIP Code, magnification (4, 10 or 40 miles) and severity (minor, moderate, major or critical). The traffic RSS feeder will provide a dynamically generated feed with the latest traffic information for a defined area. The traffic feed layer will be added to the map and placed in the Layer Control and users can open up a browser window of the traffic information.
The GeoRSS Feed reader tool adds two buttons to the MapInfo Professional interface to open the GeoRSS Manager dialog and to refresh all active GeoRSS feeds. The GeoRSS Manager allows users to enter sites that serve GeoRSS feeds to add these feeds to their maps. Examples of websites that serve GeoRSS feeds include platial.com and mapufacture.com. The dialog box for the GeoRSS Manager needs to be expanded as it is sometimes hard to see the full website link to a GeoRSS feed in the dialog box.
Raster Image Enhancements
MapInfo Professional 8.5 provides new functionality to rotate and reproject registered raster images on the fly to a different coordinate system than the source image. This new function recalculates the pixel values of the source image so that it can be displayed correctly in the destination image. MapInfo provides two methods for recalculating the pixel values: Cubic Convolution and Nearest Neighbor. Figure 7 shows two map windows; the map window on the left contains a raster image in a Latitude/Longitude projection, while the map window on the right shows the same raster image reprojected into an Albers Equal Area projection using the Cubic Convolution method.
 |
Users can access the Image Processing Preferences through the Map>Options menu or the Options>Preferences menu for more permanent settings. The Image Processing dialog allows the user to control when MapInfo will reproject images and the Resampling Method. Images can be automatically reprojected by selecting the Always or Optimized options or raster reprojection can be prevented by selecting the Never option. Once the Always or Optimized option is selected, the user can select either the Cubic Convolution or Nearest Neighbor Resampling Method. One thing to note is that MapInfo will reproject the raster image each time the map is redrawn, which can take a long time for large raster maps. Users can minimize the redraw time by setting the zoom layering option on the raster layer such that the image will be visible and reprojected only when zoomed in close.
Other raster image enhancements include an optional large crosshair in the Raster Image Registration window that enables users to select points to register raster images more accurately. MapInfo Professional 8.5 also provides a new System Setting preference that allows users to display Vertical Mapper GRD files as grid files instead of raster files. The Vertical Mapper grids can be displayed in the 3D window and their colors and legends can be changed. Users can get information about the Vertical Mapper grid cells by selecting a cell with the Info tool.
Conclusion
As I stated in my previous reviews of MapInfo Professional (8.0, 7.0), the look and feel of MapInfo Professional has been the same throughout the succession of released versions. The product innovation of MapInfo Professional continues to be driven by customer demand. The architecture of the software allows MapInfo to insert new functionality that is easy for users to find. For example, when a new tool is added, such as the Link Utility for Google Earth, it is placed in the Tool Manager so users can find the new tool easily. Experienced MapInfo Professional users should have no problem learning about the latest enhancements to the newest version of the product and should be able to apply these enhancements to their workspaces.
From Our Homepage
Saying Farewell to an Amazing Journey
Communicating with Maps
Is There a GIS Career Ladder?
What does it mean to be geospatially smart? Series
Ways Real Estate and Property Developers Utilize Melissa GeoData for Data-Driven Decisions
Unlocking Value From Daily Satellite Imagery and Insights
Maximizing the Value of Your Address Data with Geo Addressing
How Indoor Mapping Enhances the Security of Smart Buildings
Look Ahead: AI, Location Intelligence and Efficiency
Collaboration Takes on Sea Level Rise & Dynamic Technology Environments
Brownies for Brownfields
Has Everything Been Mapped Already?
How Is Data Literacy Changing in an Artificial Intelligence Landscape
Portfolios for GIS Professionals: More Than Just Maps
How to Create a Distance Matrix in QGIS - A Step-by-Step Guide
7 Ideas for Bringing GIS into the K-12 Classroom
The Geography of Movement