 GfK Macon AG
Gustav-Struve-Allee 1
D-68753 Waghaeusel,
Germany
www.gfk-macon.com
Pricing
District 8 sells for 1,798 Euros, which is equivalent to approximately $2,160.00 at the time of this writing.
Overview
District 8, a GIS package offered by the German based GfK Macon, is described on its Web site as a "regional planning" based GIS. Although regional planning may mean many things to an American audience, make no mistake, this product is squarely aimed at the business world. This is obvious from both the user manual examples, which deal almost exclusively with sales region analysis, and from the suite of tools, which have an obvious business leaning. To the software's credit, it isn't too difficult to see how some of the more business-focused tools can be used in other typical GIS region-scale analysis such as environmental work or large-scale municipal planning.
Installation
Unfortunately, there were no installation instructions included with the documentation, but I had no trouble installing the software on my GIS workstation (3.4 Ghz Intel Pentium 4 with 1 GB of RAM running Windows XP Professional). The basic install without datasets took up about 45 MB on my hard-drive. This is a very small footprint in comparison to other GIS software packages.
District 8 performed flawlessly with no system crashes on my Pentium 4 and it really did not show any performance lags. I was also able to install District 8 on my low end word-processing machine - a Pentium 266 MHz with 64 MB of RAM running Windows 98SE. Although I would not recommend running District 8 on this type of computer, it is noteworthy that it could be done at all. It would be nice if Macon was more explicit with its system recommendations, but based on my two installation attempts, I would say that a very limited computer could run this program adequately. (My guess is that a Pentium 800 Mhz with 256 MB of RAM running Windows 98SE would be able to handle this program with little difficulty.)
The User Interface
The basic GIS data display methodology employed by District 8 is layout-centric . In other words, the program displays all data on a virtual sheet of paper that is set to the user's specification. The graphic user interface (GUI) includes an array of tools, with the main "control windows" positioned by default on the left hand side of the display and the working map just to the right of these tools (see Figure 1 below). As with most Windows based applications, all the toolbars and control windows can be repositioned to fit the user's personal tastes. The toolbars can also be customized and new toolbars and tools can be added.
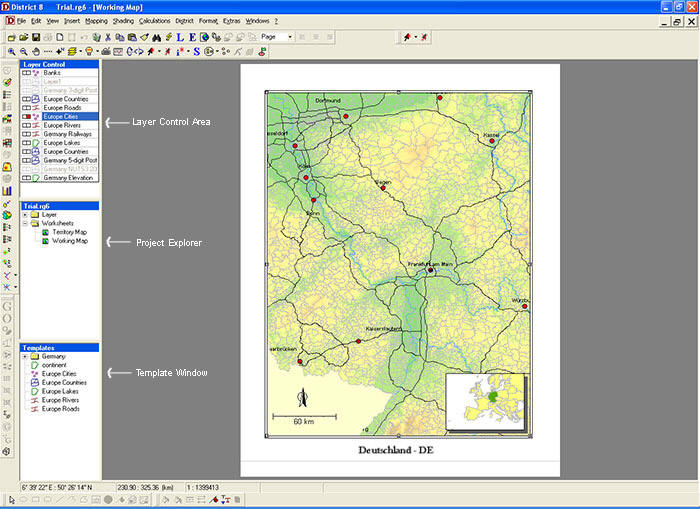 |
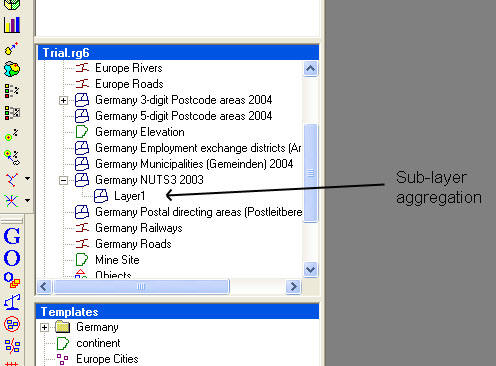
The control windows, which include a layer control box, a project explorer box and a template window, allow access to datasets and give the user control over the display properties of datasets incorporated into the map display. The Template Window allows access to available datasets something akin to Windows Explorer. The Project Explorer displays the loaded datasets and the worksheets that have been created within the current project. The Layer Control acts as the portal to controlling the loaded layers, including the control of their display properties (basic color, color gradients, hatch patterns, and various bitmaps), visibility, and whether or not a layer is the active layer.
To load layers on a map in District 8, all you need to do is make sure the layer is loaded via the template window and then drag-and-drop this layer onto the paper. The layer will display according to its defined projection, so it is important to remember that all the layers you wish to display must be in the same projection.
To gain the access to manipulate layers you double-click anywhere within the view-frame (or map-frame) of the map. This causes the layer controls to become visible, allowing access to all properties and functions of the layers. To switch back to the layout mode, click anywhere outside of the map-frame and this will switch modes.
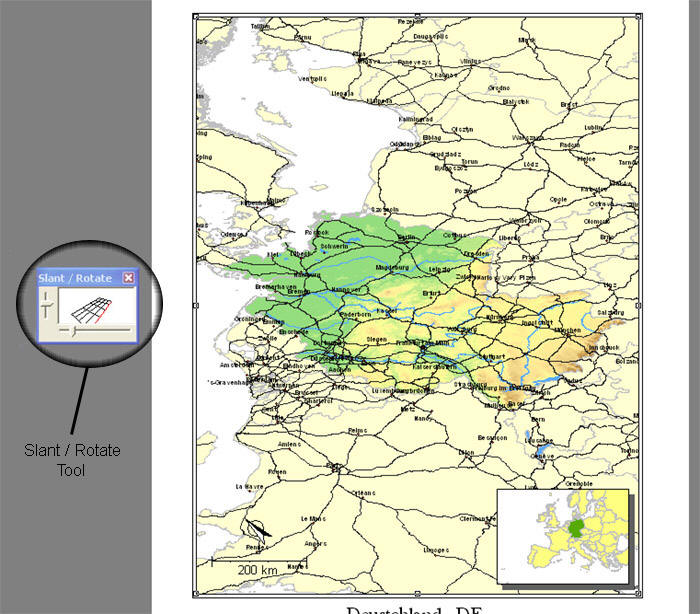
One of the more remarkable features available in the mapping mode is the ability to easily rotate and slant maps via the Slant/Rotate tool (see Figure 2 below). This allows an oblique view or a rotation of the data in a very intuitive way. Another noteworthy feature in the mapping mode is the overview map which launches in a separate window and allows you to see a contextual map that displays the location of the current view extents.
 |
There is also a complete suite of tools that allows the user to select map features in the active layer. These selection options include marquee (rectangular) selection, radius selection, polygon selection, select all, reverse selection, and select by criteria (select by various data attributes).
Working with Tables
Accessing the table, or attribute, information "behind” the spatial data is very easy. Simply right click on a layer in the Layer Properties window and select "Show layer as table” in the context menu, or double click on the layer in the Project Explorer. This gives a familiar tabular data-view that is very user friendly. The look and feel of the data table should remind many users of some of the more common spreadsheet programs. For the average Windows user, much of the functionality of the table view is very intuitive, including navigation, highlighting, changing the order of columns, deleting columns, cutting and pasting, and filling multiple selected cells with a common value.
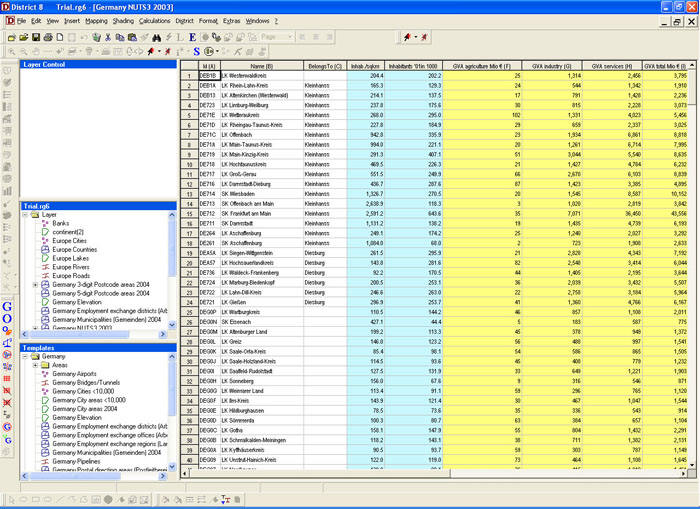 |
Table relationships in District 8 are mainly built through the key field, which is labeled "ID field” in the table view (this is a reserved field that cannot be renamed or deleted). Each of the columns in the table is also assigned a letter designation (B for column 2, C for column 3, and so on), which allows for field calculations based on formulas involving just the column letters (i.e. (E+F+G)/3). Another reserved column found in all District 8 datasets is entitled "Belongs to.” This column allows combinations of data, or districting, to be accomplished directly. (More on districting below.)
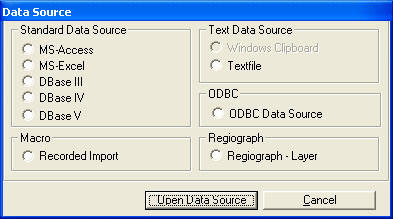
Importing of tables and creating relationships between these tables and existing District 8 datasets is also relatively simple. Supported import formats include MS-Access, MS-Excel, dBase III, IV, and V, delimited text files, and even Open Database Connectivity (ODBC) data (see Figure 4 below). The dialog boxes that manage this import process are initially similar to those in the import process found in MS-Access. However, things become a bit more complicated when you must choose which columns from the two tables to use as relate items. Although building relationships between tables may be routine to some, novice users may find District 8's methodology a bit cumbersome.
 |
The main strength of this product is its ability to create aggregations of data - or districts. Macon states that District 8 offers four aggregating functions. These include tools that:
- Group elements
- Add elements to aggregated territories
- Remove elements from aggregated territories
- Regroup elements.
 |
Although aggregations can be made manually, possibly the most powerful part of District 8 is its ability to automatically generate territories from various point data. These functions allow the generation of new districts by various methods including, but not limited to: maximum limit (i.e. regions will be created up to 25,000 people), limiting radial distance (i.e. regions will not be created beyond 100 km), point adjacency, and point clustering. There is even the ability to use an attribute as a weight to help "guide” the creation of new districts. Regions generated by these techniques can then be optimized by multiple methods including automatic optimization, optimization by suggested list, and optimization by balancing.
This districting functionality certainly gives credence to the product's name. The flexibility and power to create and manage aggregations is definitely this product's main strength. These aggregation tools are very applicable in a business setting where they will provide help in creating, re-allocating, and analyzing sales territories and customer regions.
Advanced Analysis Functions
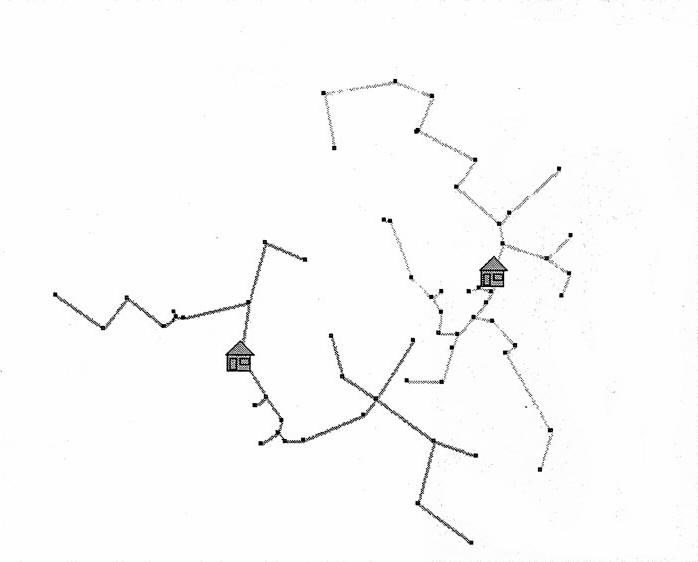
I'm not going to try to cover all of the advanced analysis features in District 8, but will highlight some of the more unusual ones. This software program is definitely not a "lightweight" when it comes to the variety of ways to spatially depict data. One of these ways is through the Rubini-graph feature, which connects points with equal characteristics in a sequential fashion. This is a very good way of visualizing the "spread” and connectivity of related point features (see Figure 6 below). The Star-depiction is another very useful way to understand the connectivity between related point features. This methodology depicts data in rays that connect from the related points back to the defined central home or headquarters. These display techniques should be very useful for sales managers who want to have a better grasp on the characteristics of the sales territories or customer bases they manage.
 |
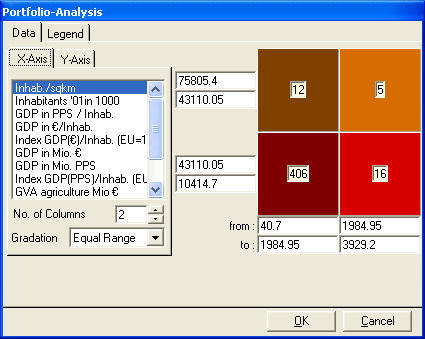
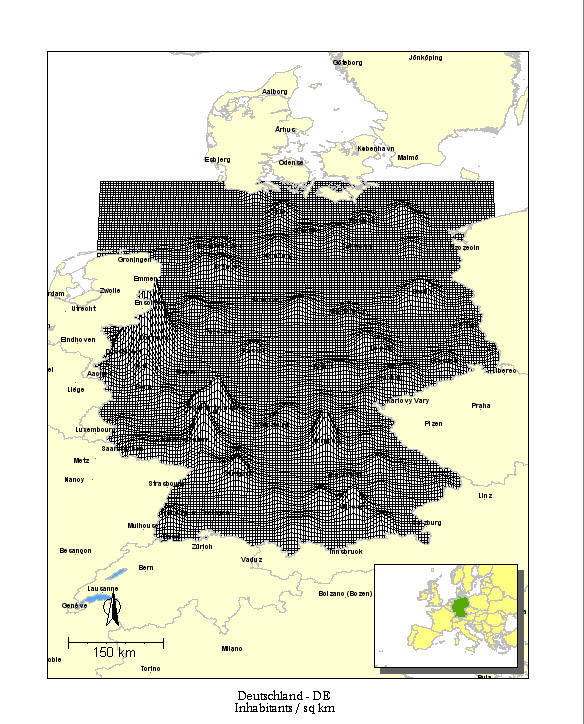
Among the many ways to visualize regions or polygon data, I found that I was most drawn to the dot-density feature. In District 8, dots in a dot-density depiction are distributed at random in a region based on some attribute of the tabular data (such as population). This distribution of dots creates a representation that is easily interpreted. Although the user should be very careful with this feature because it could easily be misused; it does give a visual that is almost universally understood. Another very useful feature for polygon/regional analysis is the Portfolio Analysis tool that allows the visualization of two variables simultaneously in a multi-shading (choropleth) format. It is not the shading that is so unique, but rather the interface which helps guide you to the end result. This matrix-like interface will be much appreciated by the novice and advanced user alike.
 |
The ability to create three-dimensional representations of attribute data for regions is also a notable feature for a product of this stature. The methodology used for this representation is grid-based. Macon has also parlayed this simplified grid analysis into other visualization methods for points and for lines. These are powerful visualization techniques that I think Macon should emphasize a bit more or possibly expand into full grid analysis.
 |
Macon has done an adequate job of basic geocode. This function allows matches to various administrative districts such as postal code zones or census based regions. My one major disappointment in this product is the inability to geocode to a standard addressed road centerline dataset. I am aware that it is a fairly complex task to develop a geocoding engine that can handle various centerline data and the multitude of variants in addressing designations, and that many stand-alone products are available to license. However, this function is mandatory when customer and business analyses are based on a physical address (not just a postal code zone), and it seems like something that should be addressed..
Charting
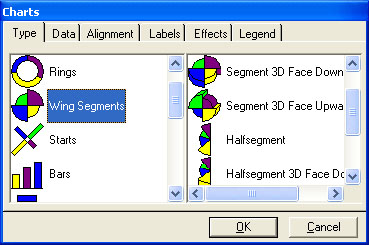
One of the more impressive aspects of District 8 compared to other similar products is its charting ability. In my opinion, these capabilities make this program a good visualization tool - especially for those who understand charting in spreadsheet programs like MS-Excel. With District 8 and an understanding of charting, a person with little GIS experience can make a very informative map that can help to reveal patterns through spatial visualization. Charting options include, but are not limited to, line, pie, ring, bar, wing, star, and cubes, including 3D variations on some of these options. Chart types can even be combined to form very interesting and descriptive variants.
 |
District 8 comes packaged with a VBA (Visual Basic for Applications) manual, which is strictly a reference to the properties and functions that are available within District 8 via Visual Basic. Macon is following suit with most full-functioned GIS programs by offering an open customization environment for their program. The manual states that some of the features of District 8 can only be accessed via VB, but it does not explicitly state which properties or functions these are. If these "hidden” properties/functions were highlighted, the VBA manual would be a bit more useful.
District 8 also includes a spatial editing environment that allows the user to create new datasets based on various map projections. The Editor lets users import ESRI shapefile data and MapInfo data - definitely a big plus. (It should be understood that all shapefile data must be in geographic coordinates to be imported into the editor. I don't know if this is the same for MapInfo data.) I was fairly successful at importing a shapefile from an outside source into the editor, but then I had no luck in displaying this data in the main District 8 environment. The data definitely appeared, but the new projection information (which matched my other District 8 data) scrambled the spatial data so badly that it did not display correctly. That was a setback and I'm thinking of sending the data to Macon to take a look.
The Editor is a necessary component if you want to create new spatial data or wants to import existing, non-native spatial datasets. Unfortunately, the Editor is a component that a new user may find difficult to understand. To improve the learning curve, I think Macon should improve its Editor manual by taking a little more time to explain concepts like projections or georeferencing.
Bottom Line
District 8 sells for 1,798 Euros, which is equivalent to approximately $2,160.00 at the time of this writing. The cost is significant, but falls within the reasonable entry price range of most sophisticated GIS packages.
Although District 8 has some impressive tools, it also has some drawbacks compared to products from Intergraph, ESRI or MapInfo. I am not sure if Macon wishes to compete in this market, but if it does, it's going to have to develop a more refined implementation that meets all the standards of the current Windows interface, develop a geocoding engine that gets to the street address level, and apply some thought to organizing their tools. I think that it should also address the layer control area, perhaps eliminating one of the windows as a default or rearranging the structure of the layer controls. To give the product more credibility, Macon also needs to make a thorough editing run through their user manual, eliminating redundancies and grammatical errors. Macon should supply tutorial data to accompany the user manual examples. It seems that Macon only offers training by its staff (either on-site or in their classroom). Since traveling to Germany is probably out of the question for most business people in the U.S., I suggest that Macon also offer on-line training to make the product viable in the American marketplace.
For the money, District 8 is a fair value, but, as it stands, I believe it will have a hard time competing in a very competitive GIS software market. To Macon's credit, I think it has done well in the development of ready-made datasets. The company has developed an astounding array of data, which includes regional data such as postal code zones, administrative areas, and census based regions for much of the world. In my mind, District 8 needs some work, but if Macon can devote time to the program, the company just might have something.
From Our Homepage
Saying Farewell to an Amazing Journey
Communicating with Maps
Is There a GIS Career Ladder?
What does it mean to be geospatially smart? Series
Ways Real Estate and Property Developers Utilize Melissa GeoData for Data-Driven Decisions
Unlocking Value From Daily Satellite Imagery and Insights
Maximizing the Value of Your Address Data with Geo Addressing
How Indoor Mapping Enhances the Security of Smart Buildings
Look Ahead: AI, Location Intelligence and Efficiency
Collaboration Takes on Sea Level Rise & Dynamic Technology Environments
Brownies for Brownfields
Has Everything Been Mapped Already?
How Is Data Literacy Changing in an Artificial Intelligence Landscape
Portfolios for GIS Professionals: More Than Just Maps
How to Create a Distance Matrix in QGIS - A Step-by-Step Guide
7 Ideas for Bringing GIS into the K-12 Classroom
The Geography of Movement