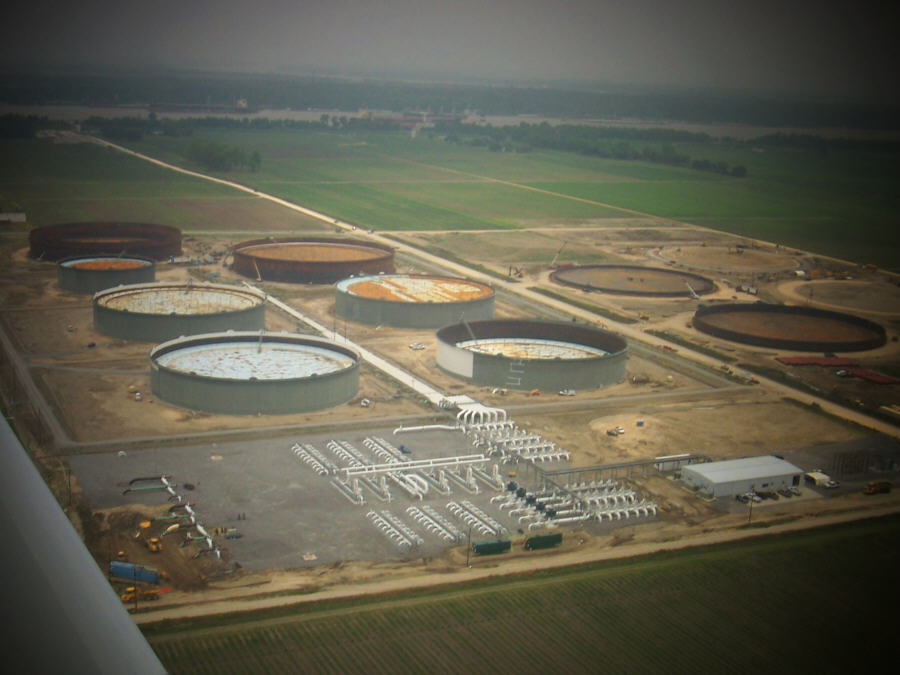
During the long process from extraction to refining,
crude oil is pumped through an intricate system of closely monitored
storage tanks and distribution pipes that help maintain an
uninterrupted flow of petroleum products to both industry and the
individual consumer.
Strictly enforced federal regulations regarding storage and transportation of crude oil require sophisticated IT systems to manage and monitor every barrel of crude oil. Oil transportation companies, such as Texas-based Plains All American Pipeline, L.P., are subject to this scrutiny.
Through a series of acquisitions and mergers during the past seven years, Plains has increased its storage capacity from 10 million to approximately 61 million barrels, and expanded its pipeline network from 2,800 to 20,000 miles, making it one of the largest independent oil transportation and storage companies in North America.
When John Waldeck, GIS manager at Plains, joined the company in August 2003, it was still using hardcopy maps for managing and monitoring its pipelines. Waldeck recently commented, "Rapid expansion has provided Plains with many opportunities but also the challenge of integrating various disparate work methods, data sources and standards. We quickly recognized the need to automate these processes, and after much review, we standardized our enterprise system on a full suite of ESRI's ArcGIS software products. This allows us to collect and manage the linear asset data regarding the location and condition of our pipelines. Our GIS is currently driven toward satisfying regulatory compliance requirements. We are using it as a resource for day-to-day operations, pipeline integrity, pipeline mileage reporting, business development and marketing, risk analysis, and automated one call. We've developed a link to our incident tracking system database in SQL to permit mapping, via an ArcGIS intranet Web browser, of any incident that occurs and to aid in the evaluation of what impact it may have on any potential high-consequence areas. In addition, we are using Oracle's Enterprise Asset Management (eAM) software to manage our storage tank attribute data, and that data is accessible through the GIS mapping system."
A key challenge to this IT strategy was integrating the two systems,
explained Doug Salvatore, information systems project coordinator at
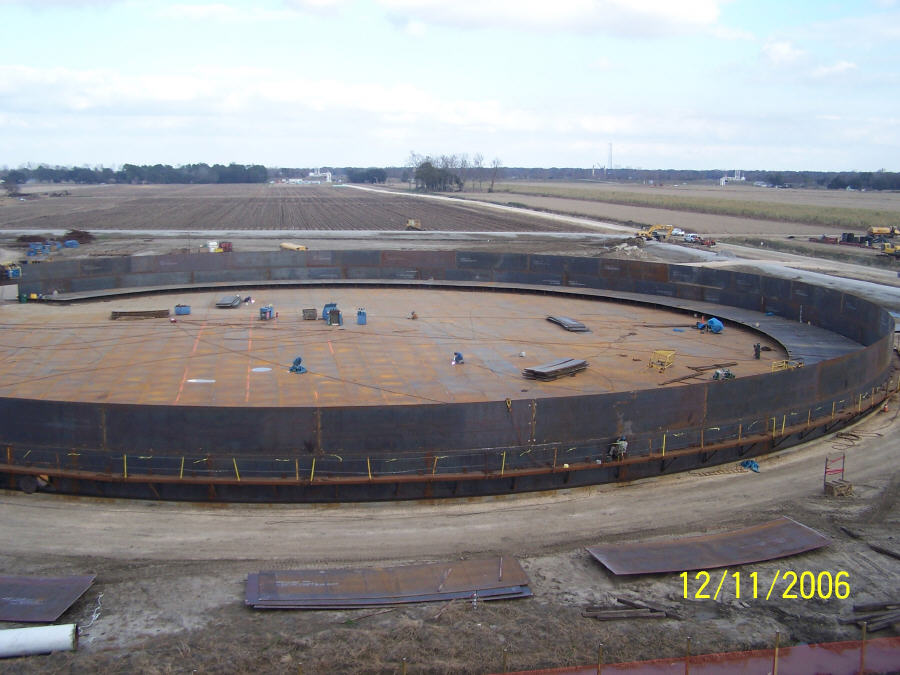
Plains. "All the various records for the tanks were compiled into a
single database that is accessed by Oracle's asset management system.
The database maintains more than 100 attributes of the tanks including
such things as the size, type, diameter, height, ownership, and
inspection details. It tells us the required frequency of
inspections and generates work orders for the Operations Group to go
out and perform the inspections when required. However, the database
had no geospatial attributes, which necessitated its integration with
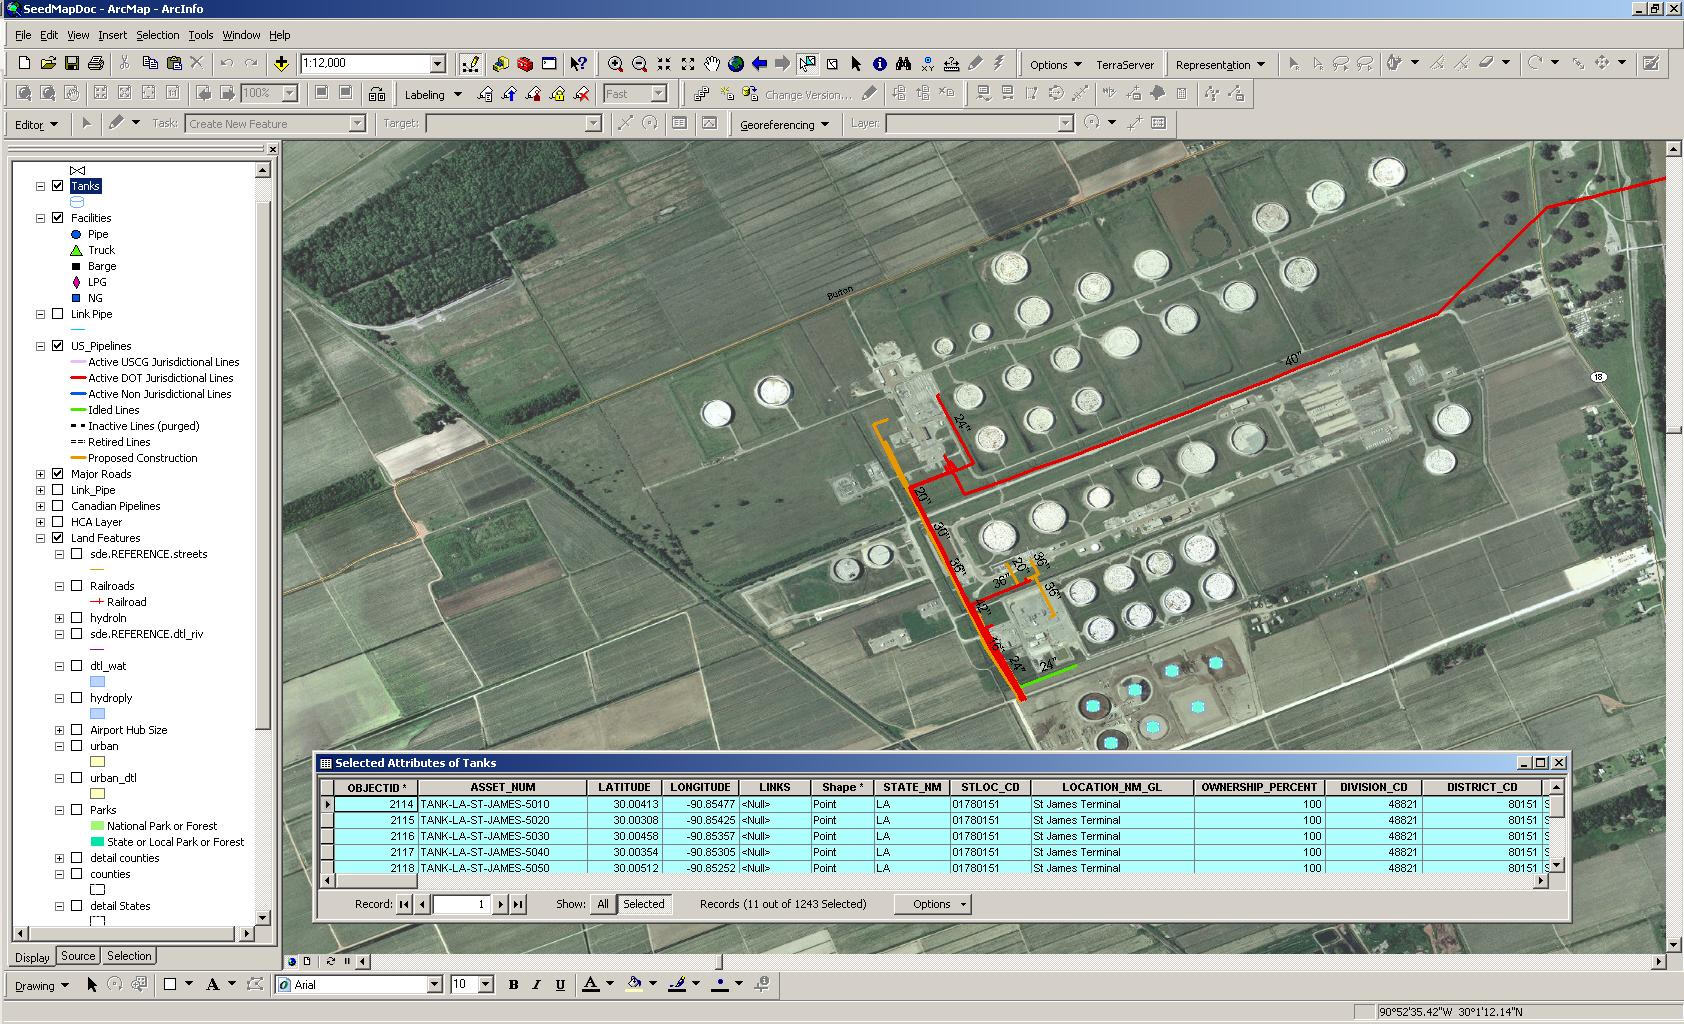
ArcGIS. By georeferencing our tanks using aerial survey data and plot
plans, we were able to apply a lat-long measurement to each tank.
Including this measurement with our unique tank asset ID number in the
data table provided access to the Oracle data through ArcGIS by
utilizing an attributed link into our geodatabase. Using existing APIs
from Oracle helped create and maintain the link between the GIS and
eAM. This gives us a GIS-based front end and its viewing and analytical
capabilities integrated with our back-office ERP (enterprise resource
planning) maintenance management system."
In its next stage, Plains is continuing the development of its GIS applications and developing greater links between the ArcGIS and eAM software. The pipeline assets are being loaded with links to the GIS pipeline segments. This is important because the pipeline industry is carefully monitored by the U.S. Department of Transportation (DOT). "This will allow us to track work orders for inspections and repairs against specific segments of the pipe in eAM with a spatial view using an ArcGIS link," explained Salvatore.
The U.S. DOT oversees oil transportation companies through its Pipeline and Hazardous Materials Safety Administration (PHMSA). PHMSA is the federal agency charged with the safe and secure movement of almost one million daily shipments of hazardous materials by all modes of transportation. It also supervises the nation's pipeline infrastructure. DOT lines, pipelines that are directly regulated by the agency, are normally 8 5/8 inches or greater in diameter, or are routed through an urban area. (State agencies regulate those pipelines that remain within their borders. Their regulations are similar to those of the DOT). Since pipelines often stretch for hundreds of miles and across state lines, the monitoring process is fairly complex. Operators are required to submit geospatial data to PHMSA’s National Pipeline Mapping System regarding the location of these lines in order to meet government requirements.
Pipeline monitoring is an ongoing and complicated activity, with
between 15 and 20 different regulatory requirements specified for every
part of the entire system to satisfy both environmental and security
concerns. For example, the vast majority of the pipelines that Plains
operates are inspected from the air with weekly over flights.
Waldeck indicated that he would like to tie Plains' right-of-way ownership database, which provides easement information for the company's pipeline network, into the GIS at some point in the near future. "This is particularly important for the DOT lines because of the public awareness program required by the Department of Transportation," commented Waldeck.
Regarding the future, Waldeck indicated that Plains plans to continue expanding the use of GIS for pipeline monitoring by including its integrity management data currently maintained by the company's Pipeline Integrity Group. "This includes historical information, ILI inspection data, anomaly locations and pipeline repairs, conditions of the soil surrounding the pipe and so on. It's the information required to keep our pipelines flowing smoothly, and including that data in the GIS will be a real benefit toward satisfying regulatory compliance and any potential audits by DOT."
 |
Strictly enforced federal regulations regarding storage and transportation of crude oil require sophisticated IT systems to manage and monitor every barrel of crude oil. Oil transportation companies, such as Texas-based Plains All American Pipeline, L.P., are subject to this scrutiny.
Through a series of acquisitions and mergers during the past seven years, Plains has increased its storage capacity from 10 million to approximately 61 million barrels, and expanded its pipeline network from 2,800 to 20,000 miles, making it one of the largest independent oil transportation and storage companies in North America.
When John Waldeck, GIS manager at Plains, joined the company in August 2003, it was still using hardcopy maps for managing and monitoring its pipelines. Waldeck recently commented, "Rapid expansion has provided Plains with many opportunities but also the challenge of integrating various disparate work methods, data sources and standards. We quickly recognized the need to automate these processes, and after much review, we standardized our enterprise system on a full suite of ESRI's ArcGIS software products. This allows us to collect and manage the linear asset data regarding the location and condition of our pipelines. Our GIS is currently driven toward satisfying regulatory compliance requirements. We are using it as a resource for day-to-day operations, pipeline integrity, pipeline mileage reporting, business development and marketing, risk analysis, and automated one call. We've developed a link to our incident tracking system database in SQL to permit mapping, via an ArcGIS intranet Web browser, of any incident that occurs and to aid in the evaluation of what impact it may have on any potential high-consequence areas. In addition, we are using Oracle's Enterprise Asset Management (eAM) software to manage our storage tank attribute data, and that data is accessible through the GIS mapping system."
 |
In its next stage, Plains is continuing the development of its GIS applications and developing greater links between the ArcGIS and eAM software. The pipeline assets are being loaded with links to the GIS pipeline segments. This is important because the pipeline industry is carefully monitored by the U.S. Department of Transportation (DOT). "This will allow us to track work orders for inspections and repairs against specific segments of the pipe in eAM with a spatial view using an ArcGIS link," explained Salvatore.
The U.S. DOT oversees oil transportation companies through its Pipeline and Hazardous Materials Safety Administration (PHMSA). PHMSA is the federal agency charged with the safe and secure movement of almost one million daily shipments of hazardous materials by all modes of transportation. It also supervises the nation's pipeline infrastructure. DOT lines, pipelines that are directly regulated by the agency, are normally 8 5/8 inches or greater in diameter, or are routed through an urban area. (State agencies regulate those pipelines that remain within their borders. Their regulations are similar to those of the DOT). Since pipelines often stretch for hundreds of miles and across state lines, the monitoring process is fairly complex. Operators are required to submit geospatial data to PHMSA’s National Pipeline Mapping System regarding the location of these lines in order to meet government requirements.
 |
Waldeck indicated that he would like to tie Plains' right-of-way ownership database, which provides easement information for the company's pipeline network, into the GIS at some point in the near future. "This is particularly important for the DOT lines because of the public awareness program required by the Department of Transportation," commented Waldeck.
Regarding the future, Waldeck indicated that Plains plans to continue expanding the use of GIS for pipeline monitoring by including its integrity management data currently maintained by the company's Pipeline Integrity Group. "This includes historical information, ILI inspection data, anomaly locations and pipeline repairs, conditions of the soil surrounding the pipe and so on. It's the information required to keep our pipelines flowing smoothly, and including that data in the GIS will be a real benefit toward satisfying regulatory compliance and any potential audits by DOT."
From Our Homepage
Saying Farewell to an Amazing Journey
Communicating with Maps
Is There a GIS Career Ladder?
What does it mean to be geospatially smart? Series
Ways Real Estate and Property Developers Utilize Melissa GeoData for Data-Driven Decisions
Unlocking Value From Daily Satellite Imagery and Insights
Maximizing the Value of Your Address Data with Geo Addressing
How Indoor Mapping Enhances the Security of Smart Buildings
Look Ahead: AI, Location Intelligence and Efficiency
Collaboration Takes on Sea Level Rise & Dynamic Technology Environments
Brownies for Brownfields
Has Everything Been Mapped Already?
How Is Data Literacy Changing in an Artificial Intelligence Landscape
Portfolios for GIS Professionals: More Than Just Maps
How to Create a Distance Matrix in QGIS - A Step-by-Step Guide
7 Ideas for Bringing GIS into the K-12 Classroom
The Geography of Movement