There are two ways to measure activity in a retail market - by supply or demand.Analysis of consumer spending reveals market demand, or retail potential.Examining business revenues, retail sales, shows market supply. ESRI Business Information Solutions (ESRI BIS) has developed a product that offers both components of economic exchange to enable a complete assessment of the retail marketplace, including the Leakage/Surplus Factor to measure the balance between supply and demand.
The Retail MarketPlace data include retail sales by industry to households and retail potential, or household spending, by establishment.Each business is identified by a four-digit North American Industry Classification System (NAICS) code.Retail sales estimate sales only to households by establishments in the Retail Trade and Food Services & Drinking Places industries in a market area.Retail potential represents consumer spending in the market area from Retail Trade and Food Services & Drinking Places. The Retail MarketPlace database provides a direct comparison between retail sales and consumer spending by industry and measures the gap between supply and demand.
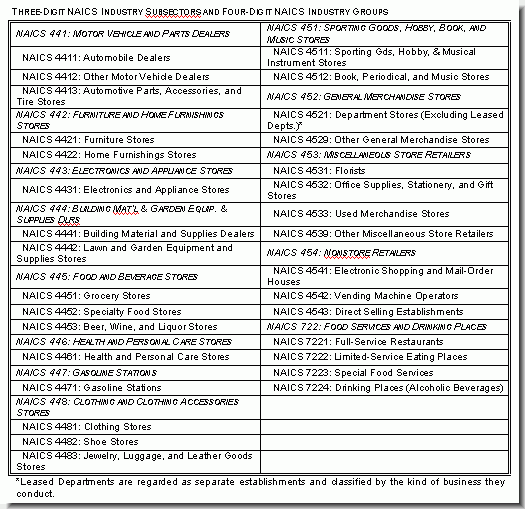
The database provides the latest market statistics for Retail Trade and Food Services & Drinking Places.The dollar estimates, which represent total retail supply and demand conditions for the past year, are presented in NAICS.These data comprise an update of supply and demand for the 27 industry groups in the Retail Trade sector, NAICS 44-45, as well as the four industry groups within the Food Services & Drinking Places subsector, NAICS 722.
Market Supply (Retail Sales)
Data for estimates of sales in the Retail Trade and Food
Services & Drinking Places industry groups begin with the benchmark,
the Census of Retail Trade (CRT) from the U.S.Census Bureau.The base
is updated with an extensive portfolio of demographic and business
databases, and a variety of commercial and government sources that include
the infoUSA business database, the Bureau of Economic Analysis, Current
Population Survey, and NPA Data Services.Supply estimates also incorporate
data from the Census Bureau's Non-Employer Statistics (NES) division.Smaller
establishments without payrolls such as self-employed individuals and unincorporated
businesses account for a small portion of overall sales.However, these
businesses represent over 70 percent of all retailers in the U.S.Their
inclusion completes the report of industry sales.
The model captures economic change since 1997 by first differentiating employer and non-employer sales growth.Trends in expenditure flows come from a variety of data sources.Multivariate statistical techniques are used to model data that are subject to disclosure issues in the CRT and NES.Data are calibrated against the Monthly Retail Trade survey that provides annual and monthly sales data for the select industries nationwide.ESRI BIS estimates sales of Retail Trade and Food Services & Drinking Places for small areas by the location of businesses derived from infoUSA's database. Finally, we estimate sales only to households in the Retail MarketPlace database.
All estimates of market supply are in nominal terms and are derived from receipts (net of sales taxes, refunds, and returns) of businesses primarily engaged in the retailing of merchandise.Excise taxes paid by the retailer or the remuneration of services; for example, installation and delivery charges, incidental to the transaction are also included.
Market Demand (Retail Potential)
To complete the profile of a retail market, we estimate consumer
demand, or retail potential, by business.That is the expected amount spent
by consumers on products (not services) in Retail Trade and Food Services
& Drinking Places.We first estimate consumer spending from
the Bureau of Labor Statistics' annual Consumer Expenditure Surveys that
provide consumer expenditure information for hundreds of goods and services
by households, but not by source.The 1997 Merchandise Line Sales from
the Census of Retail Trade are updated to estimate market demand by establishment,
four-digit NAICS industry groups from the consumer expenditure data.
The Leakage/Surplus Factor (Supply and Demand)
The Leakage/Surplus Factor enables direct comparison of supply and
demand simply in one measure.Leakage/Surplus conveniently measures the
balance between the volume of supply (retail sales) generated by retail
industry and the demand (retail potential) produced by households within
the same industry.
Leakage in an area represents a condition where a market's supply is less than the demand.That is, retailers outside the market area are fulfilling the demand for retail products; therefore, demand is "leaking out" of the trade area.Surplus in an area represents a condition where supply exceeds the area's demand.Retailers are attracting shoppers who reside outside the trade area, so the "surplus" is in the supply of retail-related products.
The following example for Fairfax County, Virginia, demonstrates how the data can reveal the Leakage/Surplus in a trade area.With a population of over one million people and nearly 370,000 households in 2003, this large county is also one of the most affluent with an average income of over $120,000.
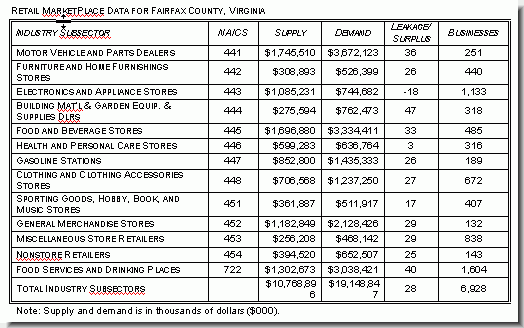
The chart lists retail sales (supply), consumer spending (demand), the Leakage/Surplus Factor, and the total number of businesses by three-digit NAICS subsectors.In this example, retail sales exceeded $10 billion in 2003, but failed to meet consumer demand! Despite the county's high level of affluence and roughly seven thousand establishments, the available supply is still not enough to accommodate demand.This example illustrates leakage in virtually every industry subsector except Electronics and Appliance Stores.
Let's focus on one example, NAICS 448, Clothing and Clothing Accessories
Stores.The 672 retailers in this industry supplied $852 million worth
of product, but still lost over $530 million to the same type of retailers
outside the county.
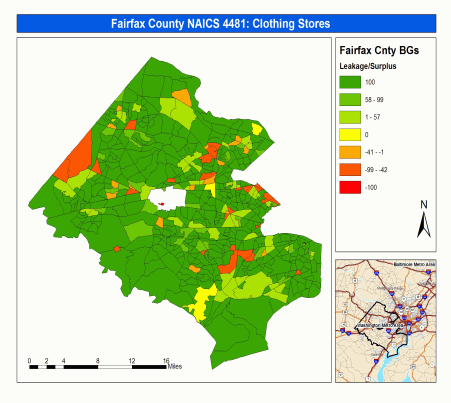
The thematic map above represents the Leakage/Surplus Factor for every block group within Fairfax County for industry group NAICS 4481, Clothing Stores.When observing data at such a low level of geography, it becomes apparent where the clothing retailers are geographically concentrated as highlighted by the orange or red shaded areas.