A quantum leap in Web graphics is happening right now.A new technology defined by the W3C called SVG (Scalable Vector Graphics) is bringing rich, compelling, interactive, high-resolution graphics to the Web.
This technology is particularly attractive to GIS developers and users.
Today, most mapping systems employ two approaches when delivering interactive maps on the web.The first approach is the familiar Java applet.The second approach involves generating map images on the server and delivering them to the user in either GIF or JPEG image format.Java applets perform well concerning interactivity, but have suffered from browser compatibility and firewall issues.Image maps are compatible with web tools and environments, but interaction with the map such as zooming, panning, layer control and thematic shading necessitate a round trip to the server in order to re-render the image.
Today, SVG solves all of these problems.SVG is an open, HTTP compatible standard that allows fully interactive mapping applications - without the need for applets or a round trip to the server every time the map presentation is tweaked.
What is SVG? The Scalable Vector Graphics (SVG) format is a new XML grammar for defining vector-based 2D graphics for the Web and other applications.SVG was created by the World Wide Web Consortium (W3C), the non-profit, industry-wide, open-standards consortium that created HTML and XML.
Scalable Vector Graphics (SVG) is an XML language for describing two-dimensional graphics.SVG allows for three types of graphic objects: vector graphic shapes (e.g., circles, rectangles, and paths consisting of straight lines and curves), images and text.These graphical objects can be grouped, styled, transformed and composited into previously rendered objects.For the highly technical members of our reading audience, the display and manipulation features include nested transformations, clipping paths, alpha masks, filter effects and template objects.
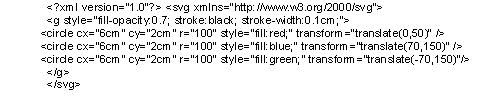
Here is an example of a simple SVG file:
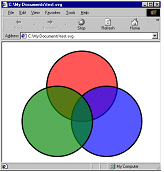
This SVG file generates the following presentation in your browser:
SVG is similar in scope to Macromedia's proprietary Flash technology.As an open W3 standard however, SVG is XML-based as opposed to a closed binary format.
In order to view SVG documents in your browser, you need to install a viewer.There are several viewers available but Adobe's SVG Viewer is probably the most commonly used.To download the viewer, go to the Adobe web site listed in the Links section at the end of this article.You need to download and install the Adobe SVG Viewer in order to view SVG documents.
SVG drawings can be interactive and dynamic.Animations can be defined and triggered either declaratively (i.e., by embedding SVG animation elements in SVG document) or via scripting.
Sophisticated client-side applications of SVG are made possible by use of a browser-based scripting language such as JavaScript, which accesses the SVG Document Object Model (DOM).The SVG DOM provides complete access to all elements, attributes and properties of the SVG document, after it is loaded into the browser.A rich set of event handlers such as onmouseover and onclick can be assigned to any SVG graphical object, thus bringing a very high level of interactivity to GIS applications that use SVG.
All of this adds up to a fully interactive, browser-based mapping system.Once a map rendered in SVG is downloaded to the browser all types of manipulation are possible - without the need for applets or having to go back to the server for a new image.
Deploying SVG documents in your web or GIS applications is very simple.You need to make sure your web server is set-up to support the MIME type for SVG, which is "image/svg+xml".It is recommended that SVG files have the extension ".svg" on all platforms.It is recommended that gzip-compressed SVG files have the extension ".svgz" on all platforms.(Yes - SVG also supports compression, with no loss of information.And since it is loss-less, it is almost always used in delivery of SVG documents).
Finally, the SVG document is included in the HTML of your web page like this:
![]()
SVG Features As They Relate to GIS
SVG has many advantages over other image formats, and particularly over JPEG and GIF, the most common graphic formats used on the Web today.Specifically:
· Plain text format -- SVG files can be read and modified by a range of tools, and are usually much smaller and more compressible than comparable JPEG or GIF images.Additionally since it is based on XML and is entirely text-based maps created in SVG are open up for search engines to index.
· Scalable -- Unlike bitmapped GIF and JPEG formats, SVG is a vector format, which means SVG images can be printed with high quality at any resolution, without the "staircase" effects you see when printing bitmapped images.
· Pan/Zoom -- You can pan and zoom very quickly in an SVG image and not see any degradation of the image, and the system does not need to go back to the server for a new image.
· Searchable and selectable text -- Unlike in bitmapped images, text in SVG text is selectable and searchable.For example, you can search for specific text strings, like city names in a map.
· Interaction -- SVG enables dynamic and interactive graphics far more sophisticated than bitmapped solutions.Map features may be made selectable and interactive from within the browser.The user may theme a map, select objects, and manipulate layers - all without a network hop back to the server.
· Animation -- SVG enables animation from within language definition itself, and through the combination of JavaScript and the SVG DOM.
· Open standard -- SVG is an open recommendation developed by a cross-industry consortium.Unlike some other graphics formats and map file formats, SVG is not proprietary.
· True XML -- As an XML grammar, SVG offers all the advantages of XML
· Open Source Solution -- SVG can be applied to GIS projects, using entirely open source tools, thus reducing the cost of implementation.
A GIS Example
At Limbic Systems, we recently developed an internet-based mapping system for a customer using SVG.This project can be seen and used at www.custommapper.com.
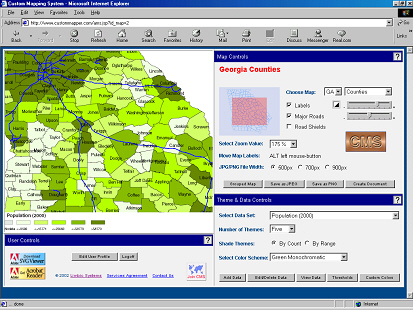
The Custom Mapping System illustrates the power of SVG in the following ways:
Dynamic theme generation:
The user can "re-theme" the map as often as they like - and never have to go back to the server for a new image.The user can change data sets, change colors, change buckets, and change from count to range algorithms right in the safety of their own browser.
Layer control:
Layers are controlled from within the browser.Streets, labels, and boundaries may be toggled on and off through the JavaScript controls included on the page.
Pan and Zoom:
The map view port may be changed dynamically, a new image is never required and the quality of the pan and zoom is outstanding.
Text Placement and Sizing:
Labels may be moved and sized by the user dynamically.
Several vendors sell GIS extensions to MapInfo and ESRI products which export maps to SVG format, thus opening this exciting, interactive world to the GIS mainstream.Links to some of these vendors are below.
Conclusion
SVG is a powerful technology when applied to GIS applications.I've only touched on its capabilities and applicability to GIS in this article.
Mapping represents a perfect application for SVG technology.Maps are by nature vector layered representations of 2D space.The SVG specification embodies the same layering concepts that are fundamental to GIS to the presentation of that data.
SVG enables maps that are informative and interactive -without the problems inherent in other technologies such as Java applets.SVG empowers distributed GIS processing, by off-loading the interactive aspects of GIS from the server to the client and combines this interactivity with very high quality output capabilities.
SVG is not a replacement for all the capabilities of a full GIS system.Rather, it represents a new way to present quality geographic information to any user on the web.
This is an exciting technology, and it will be exciting to watch it's adoption within the GIS community.
BIO
George Seff has been using GIS since 1992 when as founder, president and CTO of All Points Software he brought GIS to field data collection systems.George recently served as CTO of Claritas for five years and is now the president of Limbic Systems, Inc.(www.limbicsystems.com) a software development company specializing in J2EE, database, data warehouse, data mining and GIS applications.George may be contacted by email by clicking HERE.
Links of Interest:
SVG is becoming very popular.The links listed below serve as only a starting point for exploring this technology.
Scalable Vector Graphics (SVG) 1.0 Specification
www.w3.org/TR/SVG/
The official W3C list of implementations of Scalable Vector Graphics (SVG)
www.w3.org/Graphics/SVG/SVG-Implementations
The Adobe SVG Zone and SVG Viewer Download area.
www.adobe.com/svg/main.html
Apache Batik - open source tools for SVG manipulation.Part of the Apache Project
xml.apache.org/batik/
Map2SVG is a Web publishing tool for MapInfo Professional
www.gis-news.de/svg/map2svg.htm
SVGMapper is a Web publishing tool for ESRI ArcView
www.svgmapper.com