Navigating, Signage and More
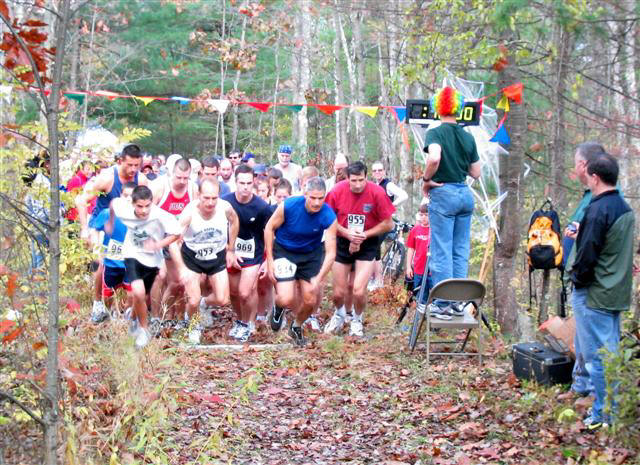
I participated in a trail race (running) over the weekend that got me thinking about navigation. Trail courses, especially longer ones, can be challenging to mark since paths often cross and there are no "standard" places to put up signs. Further, picking up the signs and markers afterward can be quite a chore. So, I was pleased to hear at the start of the 9.5 mile race that the course was well-marked and "it'd be hard to get lost." A fellow in front of me laughed and told a friend she should try to follow someone who knew the course. Yikes!
Luckily, his suggestion was not needed by me, or apparently, by anyone else because the course was indeed well marked. As I approached mile 9 my brain was still functional enough to track the blazes (white, on trees), the chalk arrows (on the ground) and my personal favorite, the survey tape that prevented runners from going down the wrong path (waist high, tied between trees). When the latter was not possible, white chalk with an "X" behind it was used as another sort of "do not enter" sign.
We use some of those sorts of cues in the built environment to navigate safely. We have "Do Not Enter," "One Way," and "Don't Walk" signs. I can say that they are only sometimes followed here in Boston. I'll offer a few reasons these signs "don't work." First, they are not always in the "right place." There are standard heights for signs and locations on the road where they are supposed to be, but those may not be optimal for those in cars, on bikes, on foot, etc. Second, not everyone operating a vehicle or walking on foot in the city is as motivated as the runners in my race to follow navigation cues. We runners don't want to get lost and end up in the cold dark woods alone (race directors want to avoid that, too!) and we certainly don't want to lose time doubling back. Those in the built environment have a variety of motivations, including, sometimes peripherally safety and not getting a ticket.
I pondered how navigation systems and signage in the real world might take better advantage of the "Do Not Enter" markings that were so effective in the woods. There are a few successful implementations on the roads. Remember the sign as you roll into the car rental return lot? "Do not back up! Severe Tire Damage." That's scared me enough to never consider that maneuver. Another one, with which we have a great familiarity in my city, involves bridges. We have bridges automobile bridges that are under construction and only open to pedestrians and bikes. The "street" part of the bridge sports a series of Jersey Barriers while the fenced, four foot wide tunnel is available for those on foot, bikes, scooters, etc. The everyday equivalents indoors are the recycling bins with holes in the shapes of cans, bottles and newspapers. You could try to put a big bag of garbage in there, but these holes gently remind you, along with signage right near the hole, "do not enter!"
I think the future of navigation is clearly some combination of positive and negative feedback, provided in many forms. Have readers seen any that are innovative? That actually work?
Talk Among Yourselves
Stefan Geens writing at his Ogle Earth blog comments on the latest Google Earth layer available: one highlighting electoral districts and candidates. He asks:
"But why is this IT news to the [Washington] Post (and to most others covering it)? It should be political news, primarily, aimed at non-techies who would never think of looking at Google Earth to find their electoral district and candidates."
Geens is quite correct that coverage is all over the tech press. I found coverage (or reprinting of material) at PC World, ElectricNews.net, Silicon.com, CNET, ZDNet, MacWorld ... At the Washington Post the coverage is at the tech blog. I've yet to find the story covered as political news.
And, that's a problem we involved in geospatial technologies continue to face. We talk among ourselves and with other IT folks far more that we speak to other potential users about the value of the geographic perspective. The intro to the Washington Post blog post is quite accurate, I suspect.
"If you're like me, you haven't used Google Earth for much more than checking out what your own backyard looks like from a satellite. The thrill of zooming in on your house is equally creepy and just plain cool. But when it comes down to it, I'm not going to use Google Earth to find driving directions."
I'd add "or anything else in my daily life." That's part of the barrier all of us involved in geospatial need to help break down. Perhaps we need a quick slogan: "Maps, they are not just for directions anymore" or "Maps: not just for techies."
I have mixed feelings when Directions Media receives a press release about the latest Google Maps mashup for real estate. Sure, that's of interest from a technology point of view to our readers, but don't these companies want to reach people who are looking to buy real estate? While there are certainly some of those who visit our sites, there are better places on the Web to find such people!
But, lest we get too disheartened, there are places where mapping technology is taking the appropriate "back seat" to a larger story. Consider this announcement of a talk to be given by Stephen Schwartz of the Monterey Institute of International Studies at UC Santa Cruz in November. He's offering a "virtual tour of past and present nuclear weapons installations around the world." Interesting, huh? Interesting to a lot of different sorts of people? The announcement goes on: "'Sites Unseen: A Virtual Tour of Past and Present Nuclear Weapons Installations Worldwide,' which will feature digital satellite photographs of weapons laboratories, test sites, major manufacturing factories, and deployment sites, such as missile silos, bomber and submarine bases, and nuclear weapons storage depots." Yes, Google Earth is mentioned, but the story is about the tour, not the technology.
People like Schwartz are the next set of users of visualization technologies on the Web and in time, more advanced analytical GIS tools. We need to speak to them as much as possible on their own terms, in their own publications about their own interests. I'm the first to admit, from a press relations and journalism perspective, this is not easy, but I believe in the long turn, it's worth the effort.
Click Here to See the Map
Computer mapping has grown so much in recent years that people expect to see maps on the Web. And, many organizations have taken that to heart, especially the media. But others have not. Here's a situation I ran into recently, that is representative of many similar situations.
The federal Corporation for National and Community Service (no, I didn't know the U.S. has one of those, but it does) released a report called "College Students Helping America." A press release introduces the report which details the state of volunteering on college campuses. The press release lists lots of stats, some of which are geographic.
"The report contains a previously released list of state volunteer rankings for college students that finds that college volunteer rates in the states range from 21.4% to 62.9%. Six of the 10 states that rank in the top ten based on overall volunteering rates also rank in the top ten for college student volunteering rates. The top states for college student volunteering were Utah, Idaho, Oklahoma, Vermont, and Nebraska."
There are links to the full report (24 page pdf), and executive summary (4 page pdf), but no link to "just a map." And there is a map, it's just hidden inside the full report - on page 14. Why not make it available online in HTML? People will link to it! Why not make it available to the press? They will reprint it and get more folks to read the report!
I participated in a trail race (running) over the weekend that got me thinking about navigation. Trail courses, especially longer ones, can be challenging to mark since paths often cross and there are no "standard" places to put up signs. Further, picking up the signs and markers afterward can be quite a chore. So, I was pleased to hear at the start of the 9.5 mile race that the course was well-marked and "it'd be hard to get lost." A fellow in front of me laughed and told a friend she should try to follow someone who knew the course. Yikes!
Luckily, his suggestion was not needed by me, or apparently, by anyone else because the course was indeed well marked. As I approached mile 9 my brain was still functional enough to track the blazes (white, on trees), the chalk arrows (on the ground) and my personal favorite, the survey tape that prevented runners from going down the wrong path (waist high, tied between trees). When the latter was not possible, white chalk with an "X" behind it was used as another sort of "do not enter" sign.
 |
We use some of those sorts of cues in the built environment to navigate safely. We have "Do Not Enter," "One Way," and "Don't Walk" signs. I can say that they are only sometimes followed here in Boston. I'll offer a few reasons these signs "don't work." First, they are not always in the "right place." There are standard heights for signs and locations on the road where they are supposed to be, but those may not be optimal for those in cars, on bikes, on foot, etc. Second, not everyone operating a vehicle or walking on foot in the city is as motivated as the runners in my race to follow navigation cues. We runners don't want to get lost and end up in the cold dark woods alone (race directors want to avoid that, too!) and we certainly don't want to lose time doubling back. Those in the built environment have a variety of motivations, including, sometimes peripherally safety and not getting a ticket.
I pondered how navigation systems and signage in the real world might take better advantage of the "Do Not Enter" markings that were so effective in the woods. There are a few successful implementations on the roads. Remember the sign as you roll into the car rental return lot? "Do not back up! Severe Tire Damage." That's scared me enough to never consider that maneuver. Another one, with which we have a great familiarity in my city, involves bridges. We have bridges automobile bridges that are under construction and only open to pedestrians and bikes. The "street" part of the bridge sports a series of Jersey Barriers while the fenced, four foot wide tunnel is available for those on foot, bikes, scooters, etc. The everyday equivalents indoors are the recycling bins with holes in the shapes of cans, bottles and newspapers. You could try to put a big bag of garbage in there, but these holes gently remind you, along with signage right near the hole, "do not enter!"
I think the future of navigation is clearly some combination of positive and negative feedback, provided in many forms. Have readers seen any that are innovative? That actually work?
Talk Among Yourselves
Stefan Geens writing at his Ogle Earth blog comments on the latest Google Earth layer available: one highlighting electoral districts and candidates. He asks:
"But why is this IT news to the [Washington] Post (and to most others covering it)? It should be political news, primarily, aimed at non-techies who would never think of looking at Google Earth to find their electoral district and candidates."
Geens is quite correct that coverage is all over the tech press. I found coverage (or reprinting of material) at PC World, ElectricNews.net, Silicon.com, CNET, ZDNet, MacWorld ... At the Washington Post the coverage is at the tech blog. I've yet to find the story covered as political news.
And, that's a problem we involved in geospatial technologies continue to face. We talk among ourselves and with other IT folks far more that we speak to other potential users about the value of the geographic perspective. The intro to the Washington Post blog post is quite accurate, I suspect.
"If you're like me, you haven't used Google Earth for much more than checking out what your own backyard looks like from a satellite. The thrill of zooming in on your house is equally creepy and just plain cool. But when it comes down to it, I'm not going to use Google Earth to find driving directions."
I'd add "or anything else in my daily life." That's part of the barrier all of us involved in geospatial need to help break down. Perhaps we need a quick slogan: "Maps, they are not just for directions anymore" or "Maps: not just for techies."
I have mixed feelings when Directions Media receives a press release about the latest Google Maps mashup for real estate. Sure, that's of interest from a technology point of view to our readers, but don't these companies want to reach people who are looking to buy real estate? While there are certainly some of those who visit our sites, there are better places on the Web to find such people!
But, lest we get too disheartened, there are places where mapping technology is taking the appropriate "back seat" to a larger story. Consider this announcement of a talk to be given by Stephen Schwartz of the Monterey Institute of International Studies at UC Santa Cruz in November. He's offering a "virtual tour of past and present nuclear weapons installations around the world." Interesting, huh? Interesting to a lot of different sorts of people? The announcement goes on: "'Sites Unseen: A Virtual Tour of Past and Present Nuclear Weapons Installations Worldwide,' which will feature digital satellite photographs of weapons laboratories, test sites, major manufacturing factories, and deployment sites, such as missile silos, bomber and submarine bases, and nuclear weapons storage depots." Yes, Google Earth is mentioned, but the story is about the tour, not the technology.
People like Schwartz are the next set of users of visualization technologies on the Web and in time, more advanced analytical GIS tools. We need to speak to them as much as possible on their own terms, in their own publications about their own interests. I'm the first to admit, from a press relations and journalism perspective, this is not easy, but I believe in the long turn, it's worth the effort.
Click Here to See the Map
Computer mapping has grown so much in recent years that people expect to see maps on the Web. And, many organizations have taken that to heart, especially the media. But others have not. Here's a situation I ran into recently, that is representative of many similar situations.
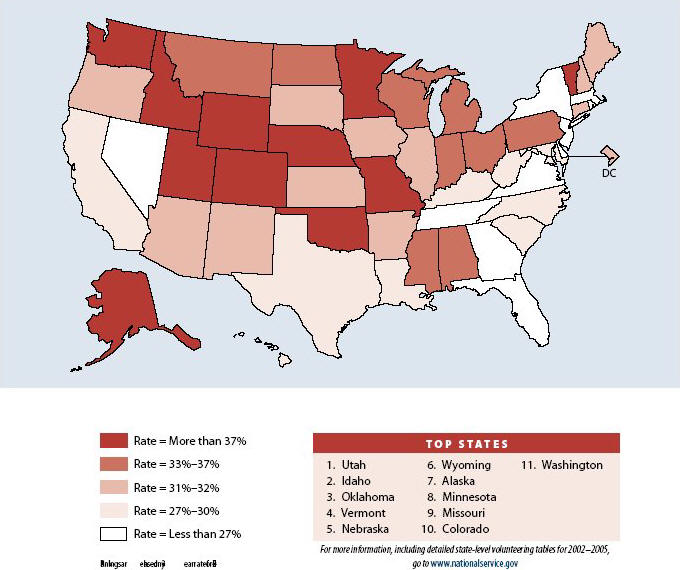
The federal Corporation for National and Community Service (no, I didn't know the U.S. has one of those, but it does) released a report called "College Students Helping America." A press release introduces the report which details the state of volunteering on college campuses. The press release lists lots of stats, some of which are geographic.
"The report contains a previously released list of state volunteer rankings for college students that finds that college volunteer rates in the states range from 21.4% to 62.9%. Six of the 10 states that rank in the top ten based on overall volunteering rates also rank in the top ten for college student volunteering rates. The top states for college student volunteering were Utah, Idaho, Oklahoma, Vermont, and Nebraska."
There are links to the full report (24 page pdf), and executive summary (4 page pdf), but no link to "just a map." And there is a map, it's just hidden inside the full report - on page 14. Why not make it available online in HTML? People will link to it! Why not make it available to the press? They will reprint it and get more folks to read the report!
 |
From Our Homepage
Saying Farewell to an Amazing Journey
Communicating with Maps
Is There a GIS Career Ladder?
What does it mean to be geospatially smart? Series
Ways Real Estate and Property Developers Utilize Melissa GeoData for Data-Driven Decisions
Unlocking Value From Daily Satellite Imagery and Insights
Maximizing the Value of Your Address Data with Geo Addressing
How Indoor Mapping Enhances the Security of Smart Buildings
Look Ahead: AI, Location Intelligence and Efficiency
Collaboration Takes on Sea Level Rise & Dynamic Technology Environments
Brownies for Brownfields
Has Everything Been Mapped Already?
How Is Data Literacy Changing in an Artificial Intelligence Landscape
Portfolios for GIS Professionals: More Than Just Maps
How to Create a Distance Matrix in QGIS - A Step-by-Step Guide
7 Ideas for Bringing GIS into the K-12 Classroom
The Geography of Movement