To explain how Scan/US identifies household change at the street level and then distributes these households to the MicroGrid cartography, let's look at one particular census block group, BG (6 37) 9201.07-1, in Valencia, as it undergoes its update process.Although this block group is one of tens of thousands of neighborhoods in the United States that has experienced household growth over the past four years, its story is interesting enough to make the strengths of this update methodology clear.
Block group 9201.07-1 is
typical of a Census 2000 block group encompassing undeveloped land on the
edge of suburban sprawl and ripe for development in this decade (see Map
1).The block group is large, covering five square miles.While the block
group contains an office park development, it had no residents at the time
of the 2000 Census.On the southwest the block group is bordered by a major
interstate, I-5, and extends 3.5 miles north to Farmer John Lat in the
hills overlooking Valencia.
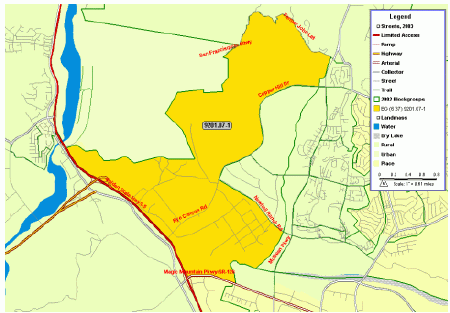
Map 1: All 5 square miles
of block group (6 37) 9201.07-1 in Valencia, CA.Click image for larger
view.
By the time of the 2004
update cycle BG 9201.07-1 had acquired 445 households with an estimated
$20.57 million in aggregate annual disposable dollars to contribute to
the local economy.The existence of these new households had been confirmed
by two independent data sources: the geocoded ADVO ZIP+4 active residential
deliveries and the block group-
allocated USPS carrier route
delivery counts.These household counts were distributed to the MicroGrids
corresponding to their block face location, with their demographic profile
assumed to be analogous to recent in-migrants in the surrounding neighborhoods.
The much finer geographic resolution of microgrids compared to block groups
allows a more focused market evaluation of the impact of these new consumers.
Assigning a Demographic
Profile to new households
When household growth occurs
in block groups with a significant base population as of Census 2000, these
new households are assumed to have a demographic profile similar to other
households in the block group.However, with no reference 2000 households
to rely on, associating a demographic profile to the new households in
BG 9201.07-1 requires a different strategy.Like thousands of other block
groups with none or only a few households in 2000, it is necessary to recruit
the demographic profile for these new households from the households in
surrounding block groups.This is done by screening nearby block groups
to identify those that had experienced rapid growth of a similar housing
type in the five years prior to the 2000 Census.The ADVO residential delivery
counts, classified into apartment and non-apartment deliveries, provide
an important clue to the type of housing being built.The demographic profile
of the most similar block group is applied to the new households.

Map 2: Block Face Points
(BFP) in study area with BG 9201.07-1 highlighted.Click image for larger
view.
Street-level assignment
of households
The basic ingredients for
allocating the nation's households to streets that they live on are:
- the TIGER Line 2003 database;
- the April 2004 USPS ZIP+4 inventory; and
- the corresponding ADVO ZIP+4 database of active residential deliveries.
Importance of the MicroGrid
cartography
The MicroGrid cartography
was designed to capture the distribution and density of residential and
business development throughout the United States at the level of detail
suitable for location-specific analysis.The MicroGrid cartography is annually
updated to accurately reflect change in the distribution.MicroGrids make
up a latticework of 1.9 million grid squares, pinned to latitude and longitude,
which serve as containers for summary data on population, households and
businesses.Where there is any locatable residential or commercial activity
you will find grids of three sizes.A minute grid approximates 1 square
mile, a 1⁄4-minute grid approximates .25 square mile and a 1/16-minute
grid approximates .0625 square mile.The density of development determines
the size of the grid: the denser the development the smaller the grid.
Where there is no development there are no grids.Block group 9201.07-1
at five square miles in size covers five times the area of the largest
grid and 80 times the area of the smallest grid.When the BFPs in block
group 9201.07-1 are summarized by MicroGrids, the spatial representation
of new households on the landscape becomes dramatically more precise.
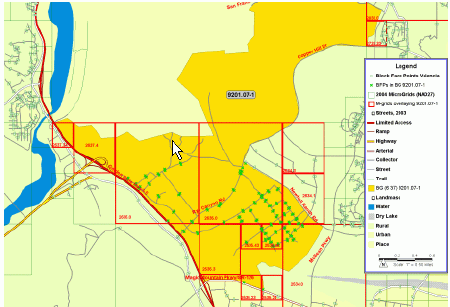
Map 3: Scan/US MicroGrid
geography overlaid on BG 9201.07-1 and the BFPs.Click image for larger
view.
Precision with MicroGrid
Cartography
So, where are the new households
in block group 9201.07-1 really located? Map 3 shows there are 14 grids
from the 2004 MicroGrid cartography that are entirely or partially within
block group 9201.07-1.The Northern half of the block group is undeveloped
and therefore no microgrids are present.Only five of the 14 grids contain
households in 2004 and only three of these had any households according
to Census 2000 (Table 1).The other nine grids contain businesses only.
Of the five grids with households, two in the extreme north pick up their
households from development in adjacent block groups.Grid 2534.0, a 1-minute
grid overlaying the southwest corner of the block group, picks up about
eight of its '04 household total of 227 from block group 9201.07-1.Grid
2535.23 has all of its 439 new households coming from block group 9201.07-1.
Most of the new households detected in BG 9201.07-1 are actually concentrated
in this 1/16-minute grid (1) at the Southern most tip of this large block
group.Grid 2525.23 is 1⁄2 mile from the intersection of Magic Mountain
Parkway and McBean Parkway, a major retail hub in Valencia.
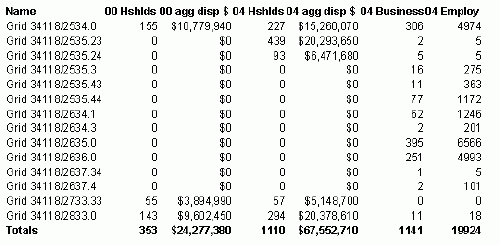
Table 1: Key data on
the 14 MicroGrids associated with BG 9201.07-1.
Click image for larger view.