This article looks into the application of supply chain
management for
GIS units that create a GIS product which entails sourcing data from
various locations and delivering the product to different locations.
The transportation of the data is done either via CD-ROM, DVD,
removable hard disks or via the LAN or Internet using FTP protocols.
The Electricity Supply Industry Geographical Information System
(ESI-GIS) at Eskom
Distribution (South Africa) was used as a case study
and the Supply
Chain Operations Reference (SCOR) was used to model the supply chain.
GIS and GIS projects can be managed on a holistic level - from determining the need for a GIS to the implementation of the GIS in an organization, or at task level where workflows are used to track and manage GIS projects.There is a management model that lies between these two approaches - namely supply chain management.A supply chain encompasses all activities associated with the flow and transformation of goods from the raw materials stage (extraction), through to the end user, as well as the associated information flows.The materials and information flow both up and down the supply chain.
To run any type of GIS application, the data needs to be sourced form various suppliers; the sourced data must be manipulated by the GIS and the GIS-product must then be delivered to a client, where the product will be displayed.
The sourcing, storing, manipulating of data as well as delivering the GIS-product indicates a typical supply chain, which necessitates supply chain management to ensure the effective use of a GIS, especially where large amounts of different data sets are used.
A GIS has the components of a supply chain, namely: sourcing, manipulation and delivering, and therefore supply chain management may be used to manage GIS-products.
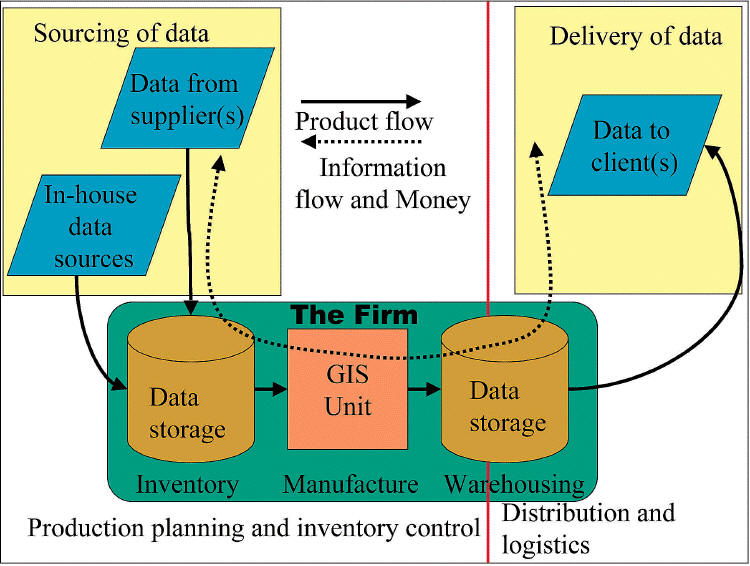
A hypothetical GIS supply chain
A client
requests a specific GIS product from the manufacturer ("the
firm") such as the Knowledge Factory or the Chief Directorate: Surveys
and Mapping.Information starts to flow from the client to the firm.
The firm then looks at the data warehouse, to establish whether the GIS
product is available or not.If available, the GIS product is
sourced from the warehouse and delivered to the client.The delivery
mechanism is part of the logistics concerning the distribution of the
GIS product and infrastructure forming part of the distribution
planning.
When the GIS product is not available in the warehouse, then it needs to be manufactured by the firm.The GIS unit, which is the manufacturing arm of the firm, plans the GIS product and sends information to interrogate the inventory for stored data sets.Some of the data sets needed for the GIS product are held in inventory but some required data will need to be sourced, either in-house or from outside suppliers.The sourcing request is sent out to the suppliers (in-house or external) and the data sets are delivered to the firm and are kept in inventory until needed for manufacturing the GIS product.This part is known as production planning and inventory control.Once the GIS product is completed, the firm delivers it to the client.
Usingf SCOR to manage the production of a GIS product
The methodology used in this case study (ESI-GIS) is based on the SCOR model from the Supply-Chain Council.Supply chain management addresses problems within five distinct process areas:
SCOR has five entities to describe the supply chain from the supplier's supplier through to the customer's customer.
Using SCOR to model ESI-GIS spatial data GIS products
ESI-GIS is a GIS unit located within Eskom Distribution.Eskom Distribution is responsible for the distribution of electricity to municipalities, industry, agriculture as well as some households.Other functions of Eskom Distribution are expansion of and maintenance of the high and medium voltage network as well as the substations.ESI-GIS provides GIS products to Eskom Distribution to assist with their mandate.For the spatial data, ESI-GIS sources data from various sources, creates the different GIS products and
delivers these products to clients.The ESI-GIS approach can be divided into the following sections:
The business context of ESI-GIS
The ESI-GIS team within the Distribution Business Support Division was formed during 2002.This came about because the Department of Minerals and Energy (DME) appointed Eskom Distribution Group to be the principal agent to provide geospatial information services to the DME.ESI-GIS also provides the same service to the Eskom Group as well as other interested parties.The service ranges from establishing and maintaining spatial information on the electricity distribution to the development of scenarios and simulation models that assist in electrification planning.Other aspects looked at in the business context of ESI-GIS are ESI-GIS's critical business issues, a SWOT analysis of ESI-GIS as well as the internal and external profile of ESI-GIS.Table 1 shows the supply chain definition matrix of ESI-GIS.The spatial data GIS product range was used as the case study using the SCOR model.
The spatial data GIS product range consists of:
ESI-GIS performance using the SCORcard
Due to time constraints as well as the non-competitive nature of ESI-GIS, it was decided not to run a benchmark, to establish performance comparisons with similar units.As the project progressed it was felt that a benchmark should be conducted.A benchmark will be run, when ESI-GIS will be re-evaluated in nine months time. During this phase, areas of improvement have been identified which were further highlighted during the disconnect analysis.
"As is" material flow and SCOR Level 2 processes
This section discusses ESI-GIS's "as is" material flow and the SCOR Level 2 process map for the spatial data GIS product range.This exercise prepared ESI-GIS to perform a disconnect analysis.
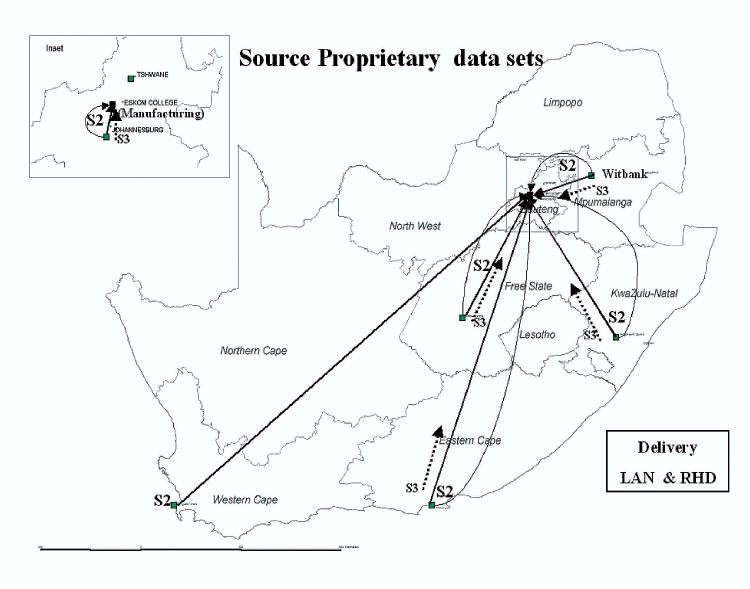
Figures 2 and 3 shows the flow of material from suppliers situated across South Africa as well as the flow of GIS products to the clients.Using information obtained from the material flow maps the SCOR Level 2 "as is" maps are drawn.
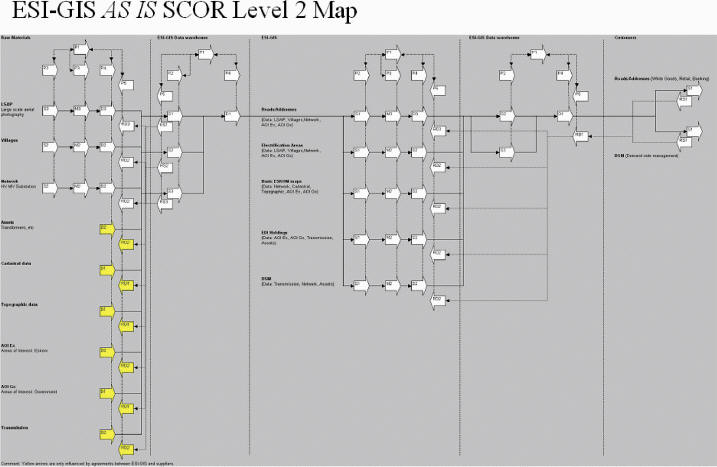
Figure 4 shows the processes involved in producing the GIS products
that
are manufactured in the spatial data product range.The data is sourced
from nine different sources and five GIS products are manufactured by
ESI-GIS.The sourced data is stored in a data warehouse form where the
data is later sourced during manufacturing.The completed GIS product
is then stored in the data warehouse and accessed when the customer
needs the GIS product.
Once the SCOR Level 2 processes were mapped, a disconnect analysis was completed with the staff from ESI-GIS.
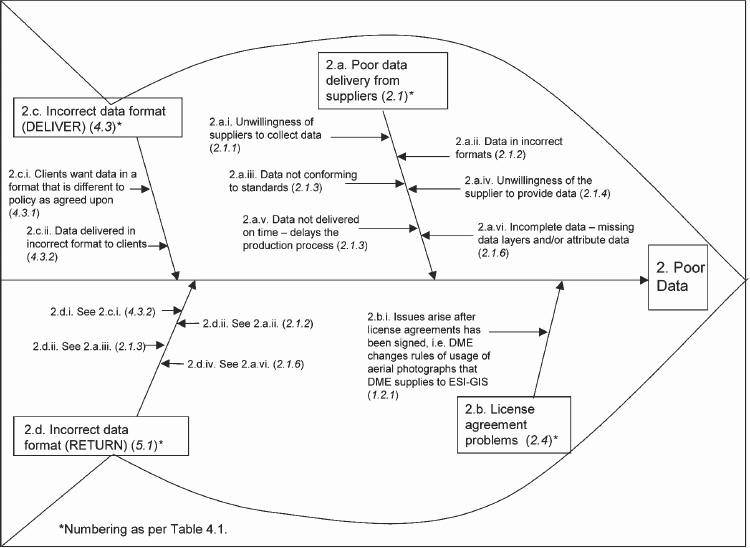
Each staff member was briefed on the SCOR methodology and then given an opportunity to list any problems they perceived and might experience in each of the five SCOR processes, (plan, source, make, deliver and return).The listed disconnects were divided into topics such as "unclear customer requirements" or "poor delivery from suppliers." These were then numbered according to the five SCOR processes, the group and the disconnect.For example, the disconnect "unwillingness of suppliers to collect data for the product" in source was given the following number 2.1.1."2" for source; "1" for the disconnect group "poor delivery from suppliers"; and the second "1" represents the disconnect.These disconnects were then recorded in table format and grouped into six unique problem statements (see Table 2).
Using the information from the two tables, a fish bone analysis was conducted to visualise each unique problem statement with its causes and sub-causes (see Figure 5).The aim is to use this information to solve the problems and to improve the performance of the supply chain.
Using the above information an opportunity analysis was done to
establish the economic value to ESI-GIS when "killing" each fish.Table
3 gives the savings that can be made by "killing" the fish, which
amounts to R 242 200 per annum.This is an acceptable saving for a unit
with a per annum income of around R4 000 000 for the 2005 financial
year.
Some problems were not seen as having a financial impact, but solving them would have a psychological impact on the staff."Poor transport'" refers to the slowness of the LAN and the Internet and "poor process performance" refers to the slow processing times of the computers in ESI-GIS, which lead to some levels of frustrations.
Using the opportunities presented during the above session, the ESI-GIS supply is then analysed at SCOR Level 3 and a "to be" supply chain is suggested.
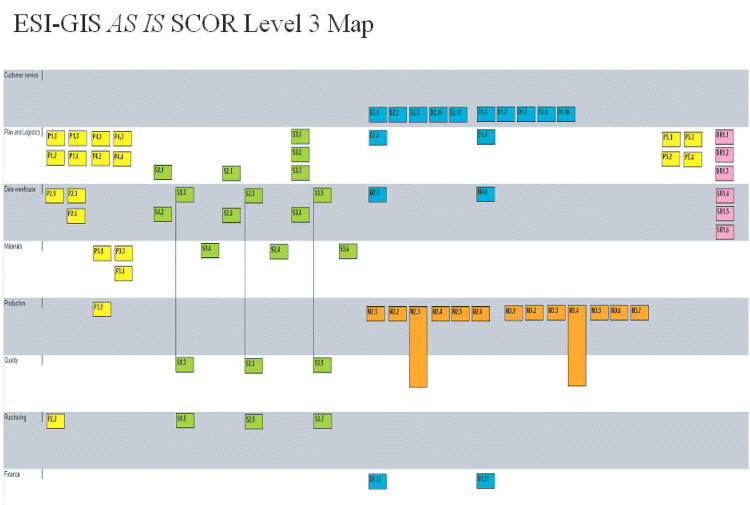
Improving the supply chain
To improve the supply chain at ESI-GIS, an "as is" SCOR Level 3 process elements map has been drawn using a SWIM diagram (see Figure 6).Using the SWIM diagram, ESI-GIS discovered that the suppliers were not involved with the whole process except when requested to provide data. It was then decided to include the suppliers in the supply chain planning process with the aim to solve the "poor data" fish.Another change was to include the customers into P1.1 (identify, prioritise, and aggregate supply-chain requirements) with the aim to solve the "unclear project requirements" fish.
Conclusions
This paper looked at the possibility of applying SCOR in a GIS environment where spatial and related non-spatial data is sourced from various locations, which are then processed (transformed) into GIS products that are delivered to clients at various locations.The application of SCOR to the GIS environment exceeded the expectations and opened up a new way of looking at the processes involved to create a GIS product.It also showed ESI-GIS that the problems experienced in ESI-GIS could be turned around into opportunities and not to be perceived as shameful.
Editor's Note:
This article was first published in PositionIT- the geoinformatics, surveying, GIS and LBS journal for Southern Africa- and has been republished with permission.
GIS and GIS projects can be managed on a holistic level - from determining the need for a GIS to the implementation of the GIS in an organization, or at task level where workflows are used to track and manage GIS projects.There is a management model that lies between these two approaches - namely supply chain management.A supply chain encompasses all activities associated with the flow and transformation of goods from the raw materials stage (extraction), through to the end user, as well as the associated information flows.The materials and information flow both up and down the supply chain.
To run any type of GIS application, the data needs to be sourced form various suppliers; the sourced data must be manipulated by the GIS and the GIS-product must then be delivered to a client, where the product will be displayed.
The sourcing, storing, manipulating of data as well as delivering the GIS-product indicates a typical supply chain, which necessitates supply chain management to ensure the effective use of a GIS, especially where large amounts of different data sets are used.
A GIS has the components of a supply chain, namely: sourcing, manipulation and delivering, and therefore supply chain management may be used to manage GIS-products.
A hypothetical GIS supply chain
 |
When the GIS product is not available in the warehouse, then it needs to be manufactured by the firm.The GIS unit, which is the manufacturing arm of the firm, plans the GIS product and sends information to interrogate the inventory for stored data sets.Some of the data sets needed for the GIS product are held in inventory but some required data will need to be sourced, either in-house or from outside suppliers.The sourcing request is sent out to the suppliers (in-house or external) and the data sets are delivered to the firm and are kept in inventory until needed for manufacturing the GIS product.This part is known as production planning and inventory control.Once the GIS product is completed, the firm delivers it to the client.
Usingf SCOR to manage the production of a GIS product
The methodology used in this case study (ESI-GIS) is based on the SCOR model from the Supply-Chain Council.Supply chain management addresses problems within five distinct process areas:
- Planning the supply chain
- Sourcing of materials (data, software, hardware)
- Manufacturing the GIS product
- Delivering the GIS product to the customer
- Handling of returned GIS products from the customer as well as returning defective materials to the supplier.
SCOR has five entities to describe the supply chain from the supplier's supplier through to the customer's customer.
- Plan, which looks at the whole supply chain based on demand and supply planning and management.Plan also looks at the execution processes of source, make and deliver.
- Source, which involves the acquisition of raw materials, supplier relationships and performance, and the verification and payment of acquired materials.
- Make, which looks at the processes of manufacturing as well as the type of manufacturing such as make-to-stock or engineer-to order.
- Deliver, which involves the delivery of the completed product either to a warehouse or directly to the customer as well as the management thereof.
- Return, which looks at the return of raw products to the supplier or the acquisition of excess products back from the customer as well as performance and business rules thereof.
Using SCOR to model ESI-GIS spatial data GIS products
ESI-GIS is a GIS unit located within Eskom Distribution.Eskom Distribution is responsible for the distribution of electricity to municipalities, industry, agriculture as well as some households.Other functions of Eskom Distribution are expansion of and maintenance of the high and medium voltage network as well as the substations.ESI-GIS provides GIS products to Eskom Distribution to assist with their mandate.For the spatial data, ESI-GIS sources data from various sources, creates the different GIS products and
delivers these products to clients.The ESI-GIS approach can be divided into the following sections:
- The business context of ESI-GIS
- ESI-GIS's performance using the SCORcard
- Mapping the "as is" material flow
- The disconnect analysis
- The opportunity analysis for
each identified unique problem statement based on the disconnect
analysis
- Identifying areas of improvement, mapping the "as is" at SCOR Level 3 as well as mapping the "to be" processes at SCOR Level 3.
The business context of ESI-GIS
The ESI-GIS team within the Distribution Business Support Division was formed during 2002.This came about because the Department of Minerals and Energy (DME) appointed Eskom Distribution Group to be the principal agent to provide geospatial information services to the DME.ESI-GIS also provides the same service to the Eskom Group as well as other interested parties.The service ranges from establishing and maintaining spatial information on the electricity distribution to the development of scenarios and simulation models that assist in electrification planning.Other aspects looked at in the business context of ESI-GIS are ESI-GIS's critical business issues, a SWOT analysis of ESI-GIS as well as the internal and external profile of ESI-GIS.Table 1 shows the supply chain definition matrix of ESI-GIS.The spatial data GIS product range was used as the case study using the SCOR model.
The spatial data GIS product range consists of:
- Roads/addresses, showing the electricity connections and other assets at street address level
- Electrification areas, currently served by Eskom
Distribution
- SC definition matrix Geography of customers/market channel Product
- Basic Eskom maps, showing cadastral information, topography and the network and areas of interest to Eskom as well as the government
- EDI Holdings, maps indicating areas of interest,
transmission lines and other assets such as substations
- Demand side management data consisting of
transmission lines, distribution networks and assets.
| SC
definition matrix |
Geography
of customers/market channel |
|
| Product |
SA
government departments |
SA parastatal organizations |
| Spatial data |
x |
x |
| Standards for AM/FM |
x |
|
| Early Warning Systems |
x |
|
| Spatial Modeling |
x |
x |
| Table 1: Supply chain definition matrix | ||
ESI-GIS performance using the SCORcard
Due to time constraints as well as the non-competitive nature of ESI-GIS, it was decided not to run a benchmark, to establish performance comparisons with similar units.As the project progressed it was felt that a benchmark should be conducted.A benchmark will be run, when ESI-GIS will be re-evaluated in nine months time. During this phase, areas of improvement have been identified which were further highlighted during the disconnect analysis.
"As is" material flow and SCOR Level 2 processes
This section discusses ESI-GIS's "as is" material flow and the SCOR Level 2 process map for the spatial data GIS product range.This exercise prepared ESI-GIS to perform a disconnect analysis.
Figures 2 and 3 shows the flow of material from suppliers situated across South Africa as well as the flow of GIS products to the clients.Using information obtained from the material flow maps the SCOR Level 2 "as is" maps are drawn.
 |
 |
 |
Once the SCOR Level 2 processes were mapped, a disconnect analysis was completed with the staff from ESI-GIS.
Each staff member was briefed on the SCOR methodology and then given an opportunity to list any problems they perceived and might experience in each of the five SCOR processes, (plan, source, make, deliver and return).The listed disconnects were divided into topics such as "unclear customer requirements" or "poor delivery from suppliers." These were then numbered according to the five SCOR processes, the group and the disconnect.For example, the disconnect "unwillingness of suppliers to collect data for the product" in source was given the following number 2.1.1."2" for source; "1" for the disconnect group "poor delivery from suppliers"; and the second "1" represents the disconnect.These disconnects were then recorded in table format and grouped into six unique problem statements (see Table 2).
| Problem
statement |
New
ID |
Old
ID |
| Unclear project requirements |
1 |
1.1 and 1.2 |
| Poor data |
2 |
2.1; 2.4;
4.3; and 5.1 |
| Poor inventory lists |
3 |
2.2 |
| Inadequate skills to perform
certain tasks |
4 |
3.2 and 4.2 |
| Poor "transport" |
5 |
2.3; 4.1;
and 5.2 |
| Poor process performance |
6 |
3.1 |
Table
2: Unique problems
statements for ESI-GIS
Using the information from the two tables, a fish bone analysis was conducted to visualise each unique problem statement with its causes and sub-causes (see Figure 5).The aim is to use this information to solve the problems and to improve the performance of the supply chain.
 |
| Problem statement |
Cost |
| Unclear project requirements |
R 75.200.00 |
| Poor data | R 75 350.00 |
| Poor inventory lists | R 18 300.00 |
| Inadequate skills to perform certain tasks | R 75 350.00 |
| Poor "transport" | R 0.00 |
| Poor process performance | R 0.00 |
| Total savings
|
R
242 200.00 |
Table
3: ESI-GIS savings by
improving the chain
Some problems were not seen as having a financial impact, but solving them would have a psychological impact on the staff."Poor transport'" refers to the slowness of the LAN and the Internet and "poor process performance" refers to the slow processing times of the computers in ESI-GIS, which lead to some levels of frustrations.
Using the opportunities presented during the above session, the ESI-GIS supply is then analysed at SCOR Level 3 and a "to be" supply chain is suggested.
Improving the supply chain
To improve the supply chain at ESI-GIS, an "as is" SCOR Level 3 process elements map has been drawn using a SWIM diagram (see Figure 6).Using the SWIM diagram, ESI-GIS discovered that the suppliers were not involved with the whole process except when requested to provide data. It was then decided to include the suppliers in the supply chain planning process with the aim to solve the "poor data" fish.Another change was to include the customers into P1.1 (identify, prioritise, and aggregate supply-chain requirements) with the aim to solve the "unclear project requirements" fish.
 |
This paper looked at the possibility of applying SCOR in a GIS environment where spatial and related non-spatial data is sourced from various locations, which are then processed (transformed) into GIS products that are delivered to clients at various locations.The application of SCOR to the GIS environment exceeded the expectations and opened up a new way of looking at the processes involved to create a GIS product.It also showed ESI-GIS that the problems experienced in ESI-GIS could be turned around into opportunities and not to be perceived as shameful.
Editor's Note:
This article was first published in PositionIT- the geoinformatics, surveying, GIS and LBS journal for Southern Africa- and has been republished with permission.
From Our Homepage
Saying Farewell to an Amazing Journey
Communicating with Maps
Is There a GIS Career Ladder?
What does it mean to be geospatially smart? Series
Ways Real Estate and Property Developers Utilize Melissa GeoData for Data-Driven Decisions
Unlocking Value From Daily Satellite Imagery and Insights
Maximizing the Value of Your Address Data with Geo Addressing
How Indoor Mapping Enhances the Security of Smart Buildings
Look Ahead: AI, Location Intelligence and Efficiency
Collaboration Takes on Sea Level Rise & Dynamic Technology Environments
Brownies for Brownfields
Has Everything Been Mapped Already?
How Is Data Literacy Changing in an Artificial Intelligence Landscape
Portfolios for GIS Professionals: More Than Just Maps
How to Create a Distance Matrix in QGIS - A Step-by-Step Guide
7 Ideas for Bringing GIS into the K-12 Classroom
The Geography of Movement