The Scalable Vector Graphics (SVG) format has its
advantages in GIS applications for rendering and publishing maps over
the Internet.Because traditionally SVG has been used as just a map
viewer,
without the capability for data processing and spatial analysis, its
potential for GIS application has been limited.Security issues have
been the main concern in SVG applications.Now, with the support and
development of World Wide Web Consortium's (W3C) Web service
technology, SVG's
performance and functionality can be greatly improved and enhanced for
GIS applications.
Traditionally, SVG maps could be edited and rendered using a variety of approaches.Once published, rendering is normally a client-side application that does not re-connect with the server.Because of this, information has to be released to all users, although in many cases not all clients are expected to access some of the certified and/or classified information.
Web Services
W3C's Web service enables decomposing the software into functional components that can be accessed and integrated through the standard Web Services Description Language (WSDL) interface.In this way, GIS functionality for data processing and spatial analysis can be componentized and further integrated to support Web GIS applications using SVG as the map format.This helps open up SVG to allow certain processes on data that needs to be secure (e.g.certain attribute data) to remain secure, while permitting freer passage of data that does not need to be secure.
WSDL Web service provides a way to connect the client-side SVG viewer with the server functions to process data, perform query functions on both spatial and non-spatial features and redraw the SVG map.By separating spatial and non-spatial features, SVG can only be a graphic format with screen canvas x, y coordinates.The secured non-spatial attribute data can be processed and accessed through the WSDL Web service.Such a query can be dynamic; the SVG map will be updated and redrawn by the service command on request.Using this approach, what the user can see in the SVG source code is only the x, y screen canvas coordinates as well as the graphic styles, without any attribute values.
Examples
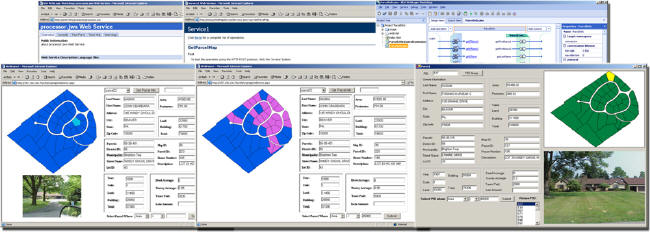
Figure 1 shows such an example.Private parcel information is not open to the public.When SVG is used in this application, the parcel dataset is separated from the spatial features.While the SVG map is generated and updated in an ASP.NET Web form, the non-spatial parcel data is served through a Java Web service created by WebLogic 7.0 with MySQL database, which also supports the non-spatial attribute query.A qualified client can access the secured parcel data and perform query functions on it.The SVG map viewer only contains the spatial feature coordinates as well as the mapping styles.
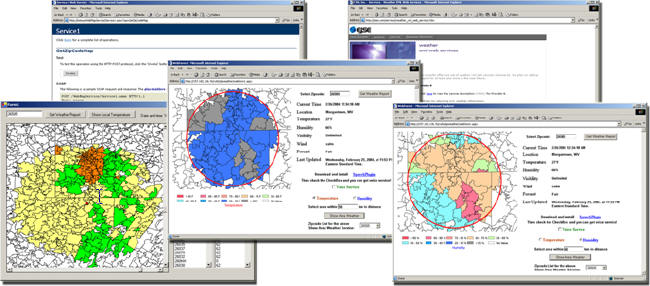
Figure 2 shows another example in which the SVG map viewer contains the
ZIP Code polygons of northern West Virginia and Southwestern
Pennsylvania.By selecting a ZIP Code on the map, the user can send a
request to the WSDL Web service provider to retrieve the concurrent
weather information while the SVG map will be redrawn to highlight the
centroid of the selected ZIP Code.Alternatively, the user can send the
request to retrieve the weather information about the surrounding
districts of the selected ZIP Code within a specified distance (e.g.50
kilometers).The SVG map will be redrawn to show the result, however,
there is no weather information inside the SVG source file if the
client wants to check it.
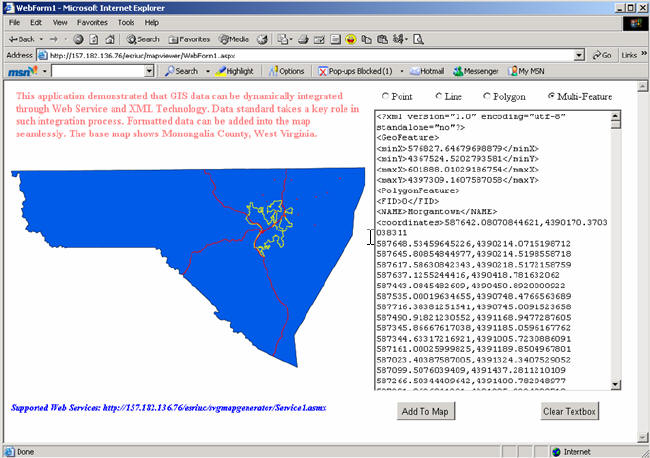
Dynamic data integration can be supported by WSDL Web services.Adding
multiple feature layers based on a client's specification has been
difficult even for commercial products for Web mapping applications,
such as ArcIMS.Once the map service file is created, the user cannot
add new feature layers into its HTML viewer.Figure 3 shows how a user
could add any kind of spatial features into an SVG map viewer.Both the
base map (county boundary polygon file in blue color) and the add
feature functions are all supported by a series of WSDL Web services.
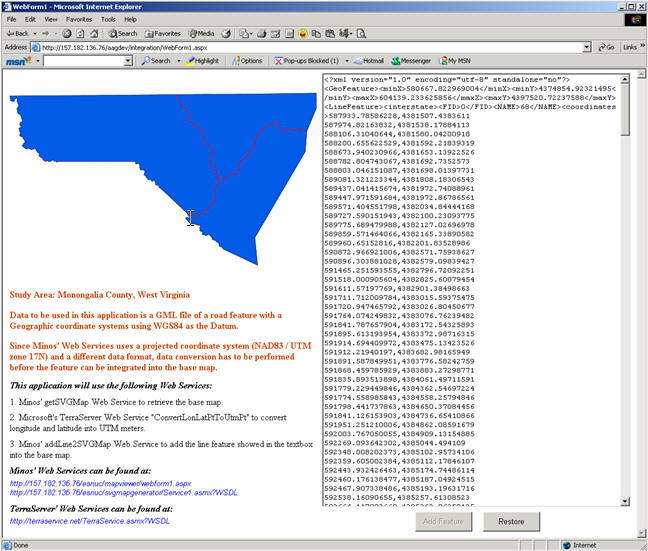
WSDL Web services can also support dynamic data conversion for
integration.The client may have data that are not compatible
with the data format used by the service provider.Figure 4 shows such
an example in which the service provider offers the data and
functionality that requires coordinate data in the UTM projection in
Zone 17th North at a datum of NAD 83 in a specific and generic XML
format, while the client has the dataset using geographic coordinates
(longitude and latitude) in GML format.In this case, the WSDL Web
service provider can convert the client's data into the data format
that is compatible to the server's data format before adding the data
into the base map.
Spatial data processing can be performed by WSDL Web services.Figure 5
shows such an example, in which new buffer polygons are created by
accepting user specified spatial features (points, polylines and
polygons) and the specified buffer distance.The provided service is
created and supported by ESRI's ArcGIS Server functions while the
result is in a generic XML format that can also be used in different
systems, such as a stand-alone Windows form application as showed in
Figure 1 and 2.
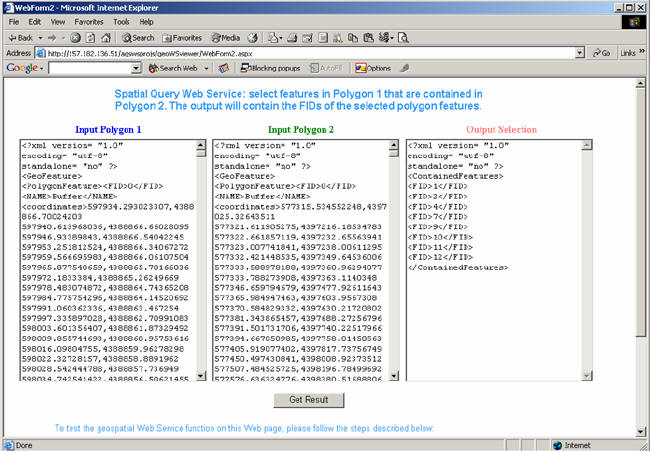
Spatial queries can also be processed by WSDL Web services.Figure 6
shows an example in which features in polygon 1 which are contained in
polygon 2 are selected.The result is a list of feature IDs in polygon
1 that
meet the query conditions.Figure 7 shows the result of a spatial data
query whereby buffered features are added onto the SVG map; the result
shows that only eight features are contained in the buffer area of the
polyline feature.Note that one buffered polygon of the point feature
is intersected rather than contained within the buffered area.Other
query functions that are supported by ArcGIS Server functions (e.g.
intersect, touch, etc.) can be developed in the same manner.
Conclusion
WSDL Web service will change the way traditional GIS functions are performed on the Web.SVG use in GIS is promising, as an SVG viewer can be enhanced and supported with GIS functions.According to an editorial from 2002, the future of Web service application in GIS "holds great promise for dedicated spatial service developers and integrators whose imagination will be the primary limit to the applications that can be built" (Ball, 2002).
Traditionally, SVG maps could be edited and rendered using a variety of approaches.Once published, rendering is normally a client-side application that does not re-connect with the server.Because of this, information has to be released to all users, although in many cases not all clients are expected to access some of the certified and/or classified information.
Web Services
W3C's Web service enables decomposing the software into functional components that can be accessed and integrated through the standard Web Services Description Language (WSDL) interface.In this way, GIS functionality for data processing and spatial analysis can be componentized and further integrated to support Web GIS applications using SVG as the map format.This helps open up SVG to allow certain processes on data that needs to be secure (e.g.certain attribute data) to remain secure, while permitting freer passage of data that does not need to be secure.
WSDL Web service provides a way to connect the client-side SVG viewer with the server functions to process data, perform query functions on both spatial and non-spatial features and redraw the SVG map.By separating spatial and non-spatial features, SVG can only be a graphic format with screen canvas x, y coordinates.The secured non-spatial attribute data can be processed and accessed through the WSDL Web service.Such a query can be dynamic; the SVG map will be updated and redrawn by the service command on request.Using this approach, what the user can see in the SVG source code is only the x, y screen canvas coordinates as well as the graphic styles, without any attribute values.
Examples
Figure 1 shows such an example.Private parcel information is not open to the public.When SVG is used in this application, the parcel dataset is separated from the spatial features.While the SVG map is generated and updated in an ASP.NET Web form, the non-spatial parcel data is served through a Java Web service created by WebLogic 7.0 with MySQL database, which also supports the non-spatial attribute query.A qualified client can access the secured parcel data and perform query functions on it.The SVG map viewer only contains the spatial feature coordinates as well as the mapping styles.
 |
 |
 |
 |
 |
 |
 |
WSDL Web service will change the way traditional GIS functions are performed on the Web.SVG use in GIS is promising, as an SVG viewer can be enhanced and supported with GIS functions.According to an editorial from 2002, the future of Web service application in GIS "holds great promise for dedicated spatial service developers and integrators whose imagination will be the primary limit to the applications that can be built" (Ball, 2002).
From Our Homepage
Saying Farewell to an Amazing Journey
Communicating with Maps
Is There a GIS Career Ladder?
What does it mean to be geospatially smart? Series
Ways Real Estate and Property Developers Utilize Melissa GeoData for Data-Driven Decisions
Unlocking Value From Daily Satellite Imagery and Insights
Maximizing the Value of Your Address Data with Geo Addressing
How Indoor Mapping Enhances the Security of Smart Buildings
Look Ahead: AI, Location Intelligence and Efficiency
Collaboration Takes on Sea Level Rise & Dynamic Technology Environments
Brownies for Brownfields
Has Everything Been Mapped Already?
How Is Data Literacy Changing in an Artificial Intelligence Landscape
Portfolios for GIS Professionals: More Than Just Maps
How to Create a Distance Matrix in QGIS - A Step-by-Step Guide
7 Ideas for Bringing GIS into the K-12 Classroom
The Geography of Movement